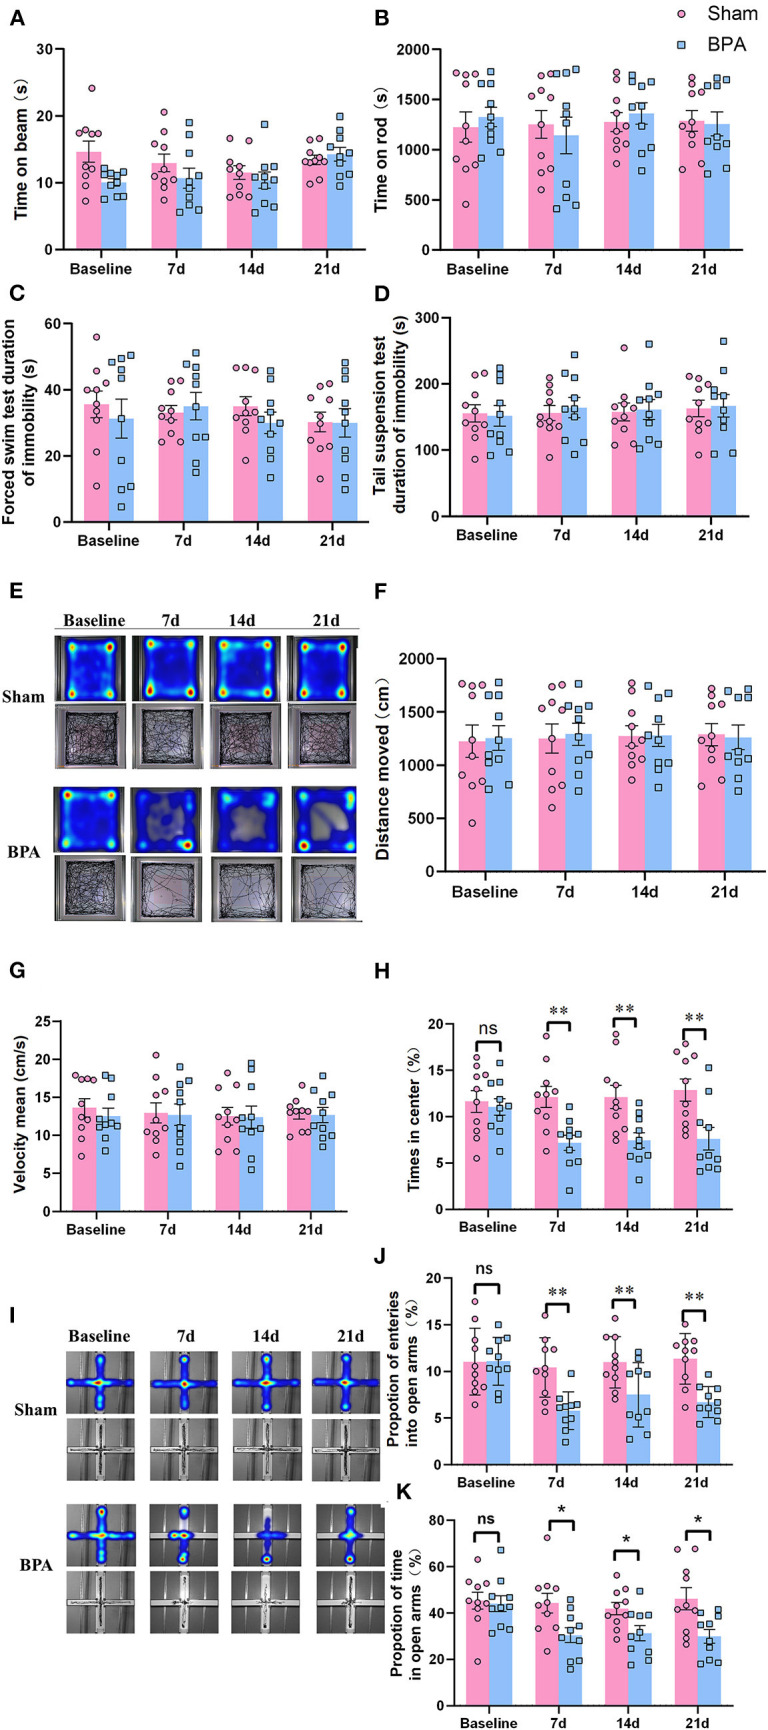
Figure 2.

Detection of depression and anxiety-like behaviors in BPA mice over time. (A) BWT detection showed no difference of the time on the beam at each time point. (B) Rota-Rod test showed no difference of the time on the rod at each time point. (C) FST showed no difference of the immobility duration at each time point. (D) TST shows no difference of the immobility duration at each time point. (E) OFT trajectory diagram in the two groups over time. (F) The movement distance from OFT test between the two groups at each time point. (G) The movement speed from OFT test between the two groups at each time point. (H) The central area residence time from OFT test between the two groups at each time point. (I) EPM trajectory diagram in the two groups. (J) EPM: The entering times of the open arms at each time point. (K) EPM: The open arm residence time at each time point. N = 10 per group. Ns = no statistical significance, *P < 0.05, **P < 0.01 vs. sham. Unpaired T-test was used for data analysis. BPA, brachial plexus avulsion; BWT, beam walking test; FST, forced swimming test; TST, tail suspension test; OFT, open field test; EPM, elevated plus-maze test.
