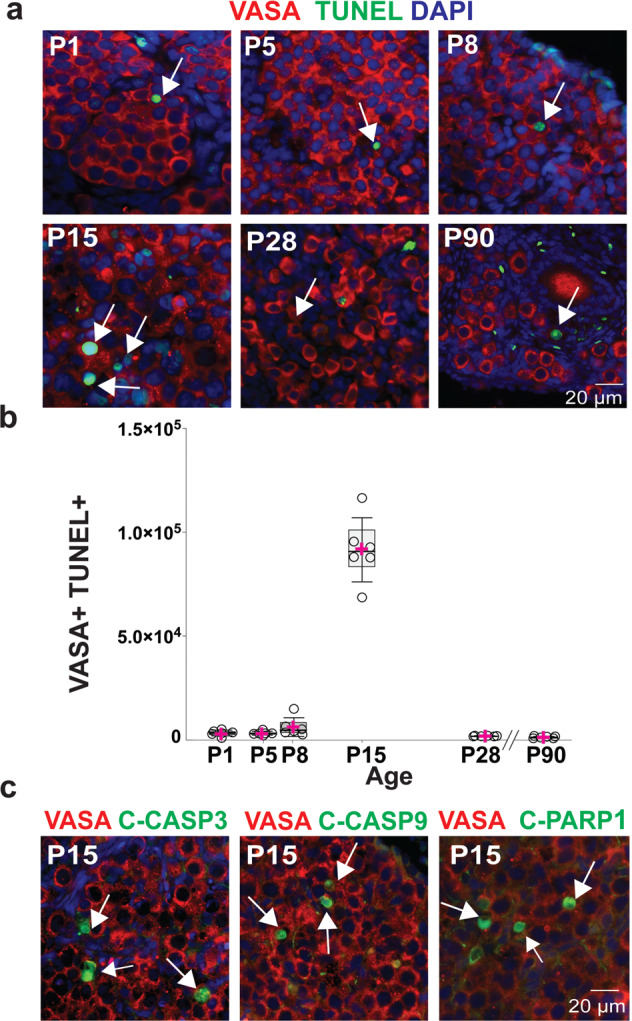
Fig. 7. Postnatal germ cell loss in the NMR ovary.

a Naked mole-rat ovaries at P1, P5, P8, P15, P28 and P90, showing the presence of apoptotic germ cells (VASA, red) using TUNEL (green). b Quantification of VASA/TUNEL cells at different stages of development (P1, P5, P8, P15, P28, P90; n = 6 per group). Box plot of TUNEL by age, the box edges represent 25th and 75th percentiles, the horizontal line inside the box represents the median, and the pink ‘+‘ represents the mean. One-way-ANOVA, adjusting for multiple comparison using Bonferroni method, only pairwise comparisons that were statistically significant at p < 0.0001 were between age 15 an all-other age. c P15 ovaries stained with VASA (red), DAPI (blue) and markers of apoptosis (red): TUNEL, cleaved-caspase-3 (C-CASP3), cleaved-caspase-9 (C-CAS9) and cleaved-poly (ADP-ribose) polymerase-1 (PARP1) (C-PARP1). White arrows indicate representative apoptotic cells. Source data are provided as a Source Data File.
