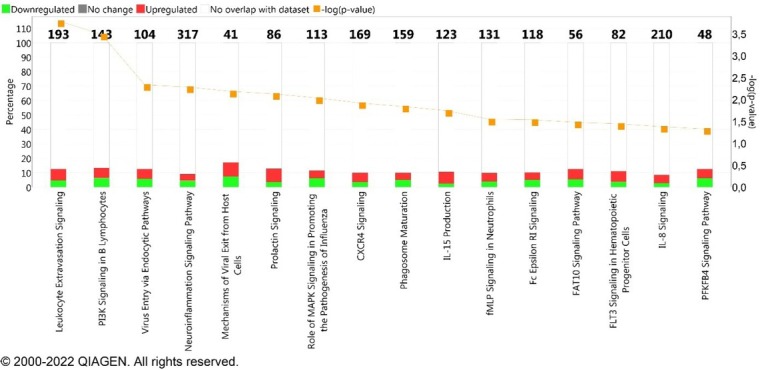
Fig. 1.

Top canonical pathways enriched in differentially expressed genes (DEGs). The value of −log(p) >1.3 reflects a significant association between the canonical pathway and the involved genes. The percentage indicates the number of DEGs overlapping with molecules associated to canonical pathways. The colours represent up- (red) and downregulated (green) genes. The numbers on top of the bars represent the total number of molecules associated to each pathway
