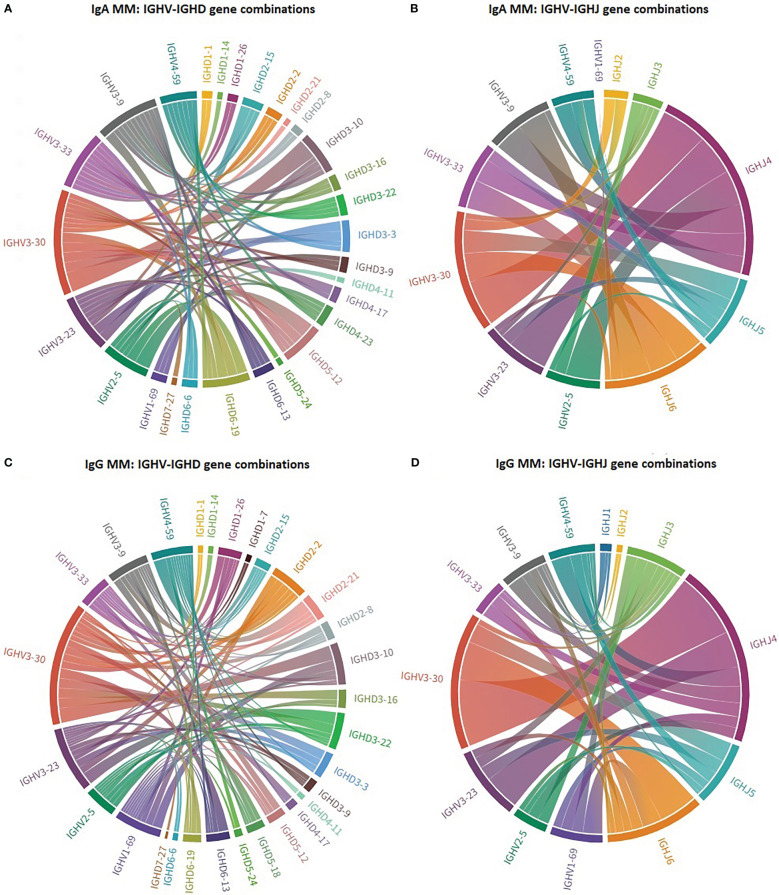
Figure 2.
Biased IG gene pairings in multiple myeloma. Circos plot presenting IGHV-IGHD-IGHJ combinations of the 7 most frequent IGHV genes in IgA MM and IgG MM. The Circos software package was used to depict the predominant combinations between IGHV and IGHD genes [(A) IgA and (C) IgG patients] as well as between IGHV and IGHJ genes [(B) IgA and (D) IgG patients] in both MM groups.

