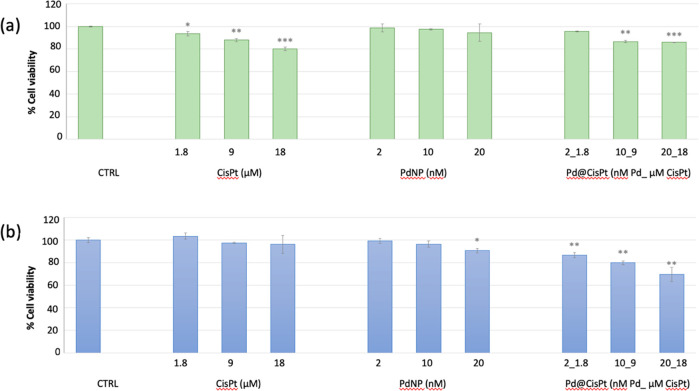
Figure 4.
Cell viability measured by (a) nuclear detection (imaging kit Blue/Green) and (b) mitochondrial succinate dehydrogenase activity (MTT assay) in PC-3 cells p.19 treated for 24 h with Pd@CiSt at increasing concentrations. Negative (untreated cells) and positive (i.e., cells treated with cisplatin or PdNP) controls are included. The data are expressed as the average percentage ± SD of three different experiments. Pairwise Student’s t test: *p < 0.05; **p < 0.01; ***p < 0.001 vs Ctrl.

