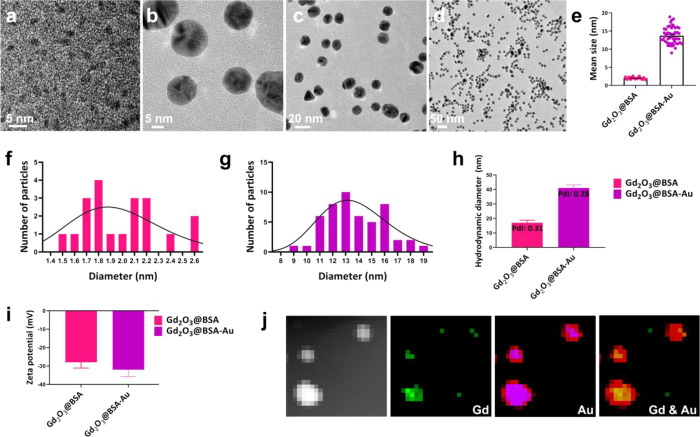
Figure 2.
TEM image of (a) Gd2O3@BSA and (b–d) Gd2O3@BSA-Au; corresponding size distribution histograms with a lognormal fit (e) Gd2O3@BSA and Gd2O3@BSA-Au; (f–g) diameter distribution for Gd2O3@BSA and Gd2O3@BSA-Au; (h) hydrodynamic size of NPs; (i) zeta potential of NPs; (j) TEM-EDS mapping of Gd2O3@BSA-Au.

