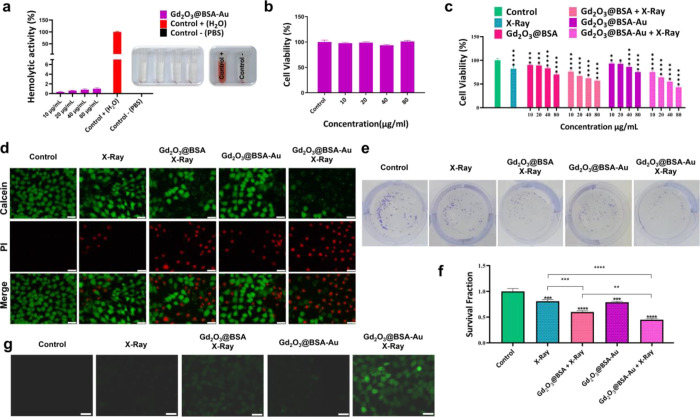
Figure 4.
(a) Hemolysis assay graph and related photographs; (b) cell viability result of Gd2O3@BSA-Au on HUVEC cells; in vitro anticancer result of different treatment plans in the presence and absence of X-ray irradiation. (c) MTT assay on 4T1 cells, (d) imaging of live and dead cells stained with Calcein AM/PI, (e) digital photographs of the clonogenic assay; (f) cell survival data obtained from the clonogenic assay; (g) intracellular ROS production detection in the presence and absence of X-ray irradiation. Data = mean ± SD; *p < 0.05, **p < 0.01, ***p < 0.001, and ****p < 0.0001 compared to the control group.

