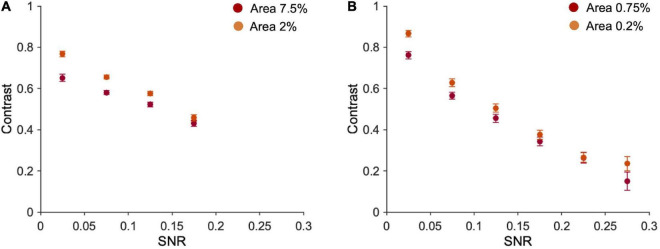
FIGURE 5.
Fragments’ contrast vs. their SNR. (A) Average contrast of ten fragments vs. their average SNR (bins of 0.05 each). Number of occurrences in each bin (from the first to the last bin), 7.5% area: 345, 1,380,783,491; 2% area: 497,1202,857,444. (B) Average contrast vs. averaged SNR of one fragment (bins of 0.05 each). Error bars are standard errors. Number of occurrences in each bin (from the first to the last bin) = 0.75% area: 834,873,586,425,235,47; 2% area: 748,764,620,440, 308,120.

