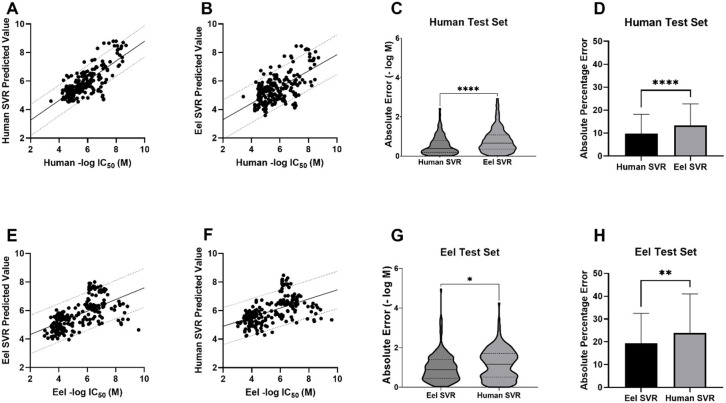
Figure 2.
SVR models for the prediction of AChE inhibition in human and eel test sets. (A) The human test set predicted with the human SVR model. MAPE = 9.73%, MAE = 0.55 ± 0.48 (SD), RMSE = 0.73, Pearson’s r = 0.76, R2 = 0.58, two-tailed P value <0.0001. The line shows a simple linear regression with 90% prediction bands. (B) The human test set predicted with the eel SVR model. MAPE = 13.4%, MAE = 0.79 ± 0.60, RMSE = 0.99, Pearson’s r = 0.61, R2 = 0.38, two-tailed P value <0.0001. (C) Comparison of absolute error for real vs predicted value of the human test set using the human or the eel SVR model (−log M). Unpaired t test with Welch’s correction, P < 0.0001. (D) Comparison of absolute percentage errors for real vs predicted value of the human test set using the human or the eel SVR model. Unpaired t test with Welch’s correction, P < 0.0001. (E) The eel test set predicted with the eel SVR model. MAPE = 19.4%, MAE = 0.99 ± 0.71, RMSE = 1.22, Pearson’s r = 0.60, R2 = 0.36, two-tailed P value <0.0001 F) The eel test set predicted with the human SVR model. MAPE = 23.9%, MAE = 1.16 ± 0.77, RMSE = 1.39, Pearson’s r = 0.52, R2 = 0.27, two-tailed P value <0.0001. (G) Comparison of absolute error for real vs predicted value of the eel test set using the human or the eel SVR model, in −log(M). Unpaired t test with Welch’s correction, P = 0.0226. (H) Comparison of absolute percentage errors for real vs predicted value of the eel test set using the human or the eel SVR model. Unpaired t test with Welch’s correction, P = 0.0033. (MAPE = mean absolute percentage error, MAE = mean absolute error, R2 = coefficient of determination; RMSE = root-mean-squared error.)

