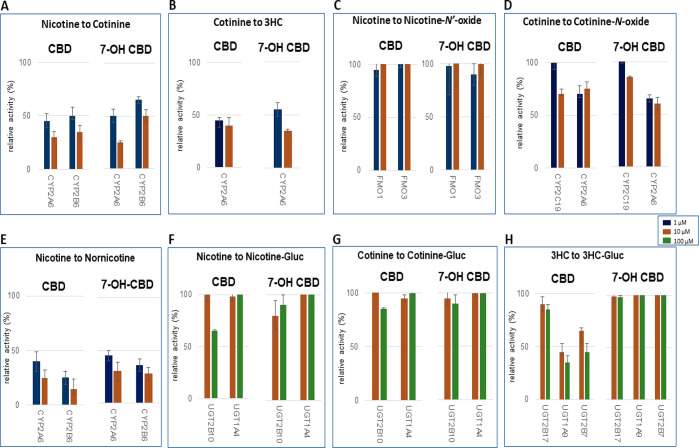
Figure 3.
Screening of CBD and 7-OH-CBD inhibition of major nicotine metabolic pathways in microsomes from CYP-, FMO-, and UGT-overexpressing HEK293 cells. Incubations were performed using 1 or 10 μM cannabinoid, with nicotine, cotinine, and 3HC concentrations at or close to their known KM for their corresponding enzyme: 100 μM, 500 μM, 1 mM, 50 μM, 100 μM, and 5 mM nicotine for cotinine (CYP2A6), cotinine (CYP2B6), NOX (FMOs 1 and 3), nornicotine (CYP2A6), nornicotine (CYP2B6), and nicotine-Gluc (UGT2B10 and UGT1A4) formation reactions, respectively; 100 μM (CYP2A6), 1 mM (CYP2C19 and CYP2A6), and 5 mM (UGT2B17) cotinine for 3HC, COX, and cotinine-Gluc formation reactions, respectively; and 30 mM 3HC for 3HC-Gluc formation reactions (UGT1A9 and UGT2B7). (A) Nicotine to cotinine formation; (B) cotinine to 3HC formation; (C) nicotine to NOX formation; (D) cotinine to COX formation; (E) nicotine to nornicotine formation; (F) nicotine to nicotine-Gluc formation; (G) cotinine to cotinine-Gluc formation; and (H) 3HC to 3HC-Gluc formation. Shown are the mean inhibitions of three individual experiments performed for each cannabinoid against nicotine, cotinine, or 3HC as substrate. Data are expressed as a percentage of metabolite formation formed in assays with cannabinoid compared to assays without cannabinoid.

