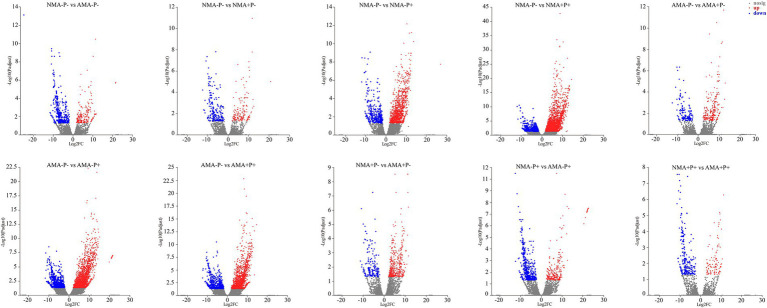
Figure 5.
Analysis of DEGs in alfalfa in the comparisons NMA−P− vs. AMA−P−, NMA−P− vs. NMA+P−, NMA−P− vs. NMA−P+, NMA−P− vs. NMA+P+, AMA−P− vs. AMA+P−, AMA−P− vs. AMA−P+, AMA−P− vs. AMA+P+, NMA+P− vs. AMA+P−, NMA−P+ vs. AMA−P+, and NMA+P+ vs. AMA+P+. The x-axis represents the gene expression fold changes between any two groups. The y-axis represents the statistical test value for the difference in gene expression [−log10(Padjust)]. The scattered points represent each gene. No significant difference is indicated by gray, whereas significant upregulation and downregulation are indicated by red and blue, respectively. DEGs, differentially expressed genes.

