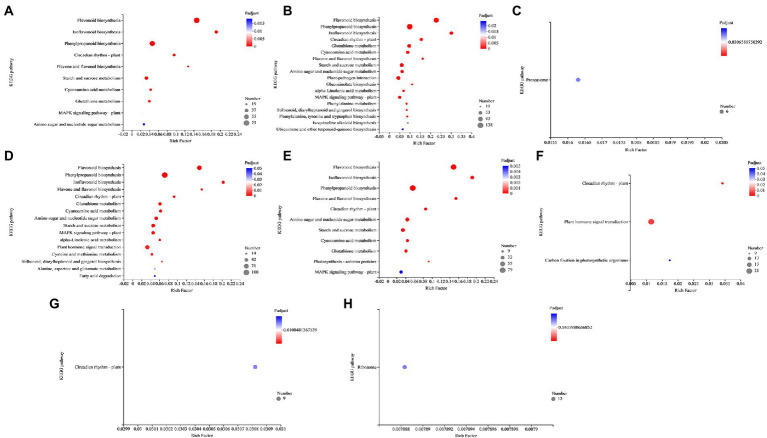
Figure 8.
KEGG pathway enrichment analysis in the comparisons (A) NMA−P− vs. NMA−P+, (B) NMA−P− vs. NMA+P+, (C) AMA−P− vs. AMA+P−, (D) AMA−P− vs. AMA−P+, (E) AMA−P− vs. AMA+P+, (F) NMA−P− vs. AMA+P−, (G) NMA−P+ vs. AMA−P+, and (H) NMA+P+ vs. AMA+P+. The top 20 KEGG pathways are displayed based on differentially expressed genes (padjust < 0.05). The x-axis displays the rich factor, which is the ratio of enriched genes to annotated genes; the larger the rich factor, the more strongly significant the enrichment. The y-axis shows the KEGG pathway. The point size represents the number of genes and the point color indicates the Padjust value. KEGG, Kyoto Encyclopedia of Genes and Genomes.

