Figure 1.
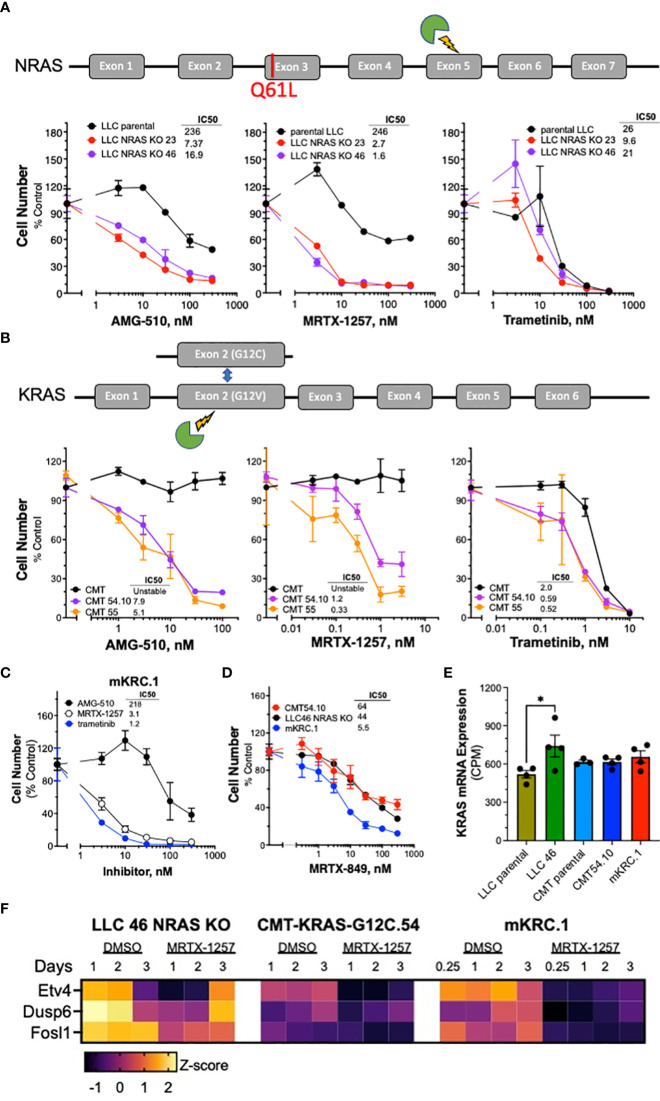
Murine KRASG12C-mutant lung cancer cell lines demonstrate sensitivity to KRASG12C and MEK inhibitors. Schematic of CRISPR/Cas9 strategies are overlayed above each respective cell line panel. (A) Parental LLCs and 2 independent LLC clones harboring NRAS KO, (B) CMTs and 2 independent CMT clones with KRAS G12C substitutions. The parental and edited murine cell lines as well as (C) mKRC.1 were plated at 100-200 cells/well in triplicate in a 96-well plate, and then treated with increasing concentrations of the KRASG12C inhibitors MRTX-1257, AMG-510, MRTX-849 (D) and the MEK inhibitor, trametinib. Cell number was assessed 7-10 days later with the CyQuant assay. The data are the means ± SEM of triplicate determinations and presented as percent of the values measured in DMSO control wells. The experiments shown are representative of 2 to 3 independent experiments. The IC50 values were calculated with Prism 9 and the “log(inhibitor) vs. normalized response” function and presented within the individual dose-response curves as shown. Also, the IC50 values and their associated 95% confidence intervals are presented in Supplementary Table S2 . (E) RNAseq data were used to compare the levels of KRAS mRNA (in CPMs) in the indicated murine KRASG12C-positive cell lines. The values represent the mean and SEM of 3-4 independent values. The data were analyzed by one-way ANOVA and only the increased KRAS mRNA levels in LLC 46 NRAS KO cells was significantly different from the other cell lines. (F) LLC 46 NRAS KO, CMT-KRAS-G12C.54 and mKRC.1 cells were treated for 6 hrs to 3 days with DMSO or 30 nM MRTX-1257, total RNA was collected and submitted to RNAseq. The expression levels (in CPMs) of the indicated MAP kinase pathway target genes were converted to Z-scores and presented as a heatmap.

