Fig. 2.
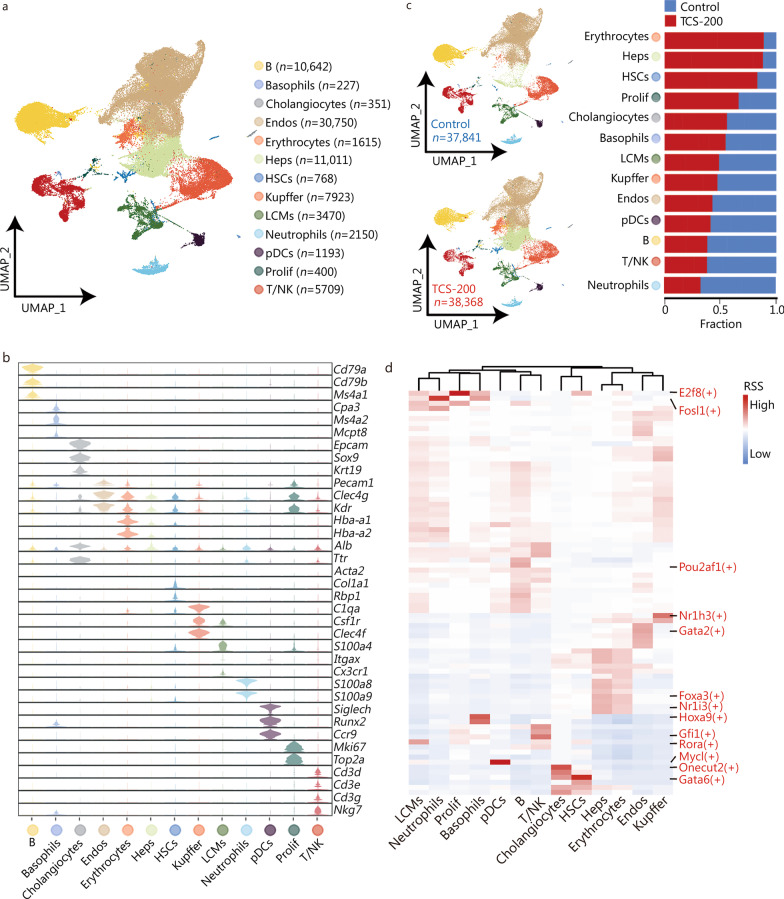
Cell diversity in mice liver cells delineated by single-cell transcriptome. a UMAP visualization of 13 cell types based on 76,209 single-cell transcriptomes. Cell counts for each individual cell type are indicated in parentheses. Each dot represents a single cell. b Violin plots showing the expression levels of representative markers in each cell type. c Distribution of each cell type in control and TCS-200 groups. The bar chart showed the relative fraction of each cell type in different groups. d Heatmap of transcription factor (TF) activities in each cell type. UMAP Uniform Manifold Approximation and Projection for Dimension Reduction, Endos endothelial cells, Heps hepatocytes, HSCs hepatic stellate cells, LCMs liver capsular macrophages, pDCs plasmacytoid dendritic cells, Prolif proliferative cells, T/NK T/natural killer cells, TCS triclosan, RSS regulon specificity score

