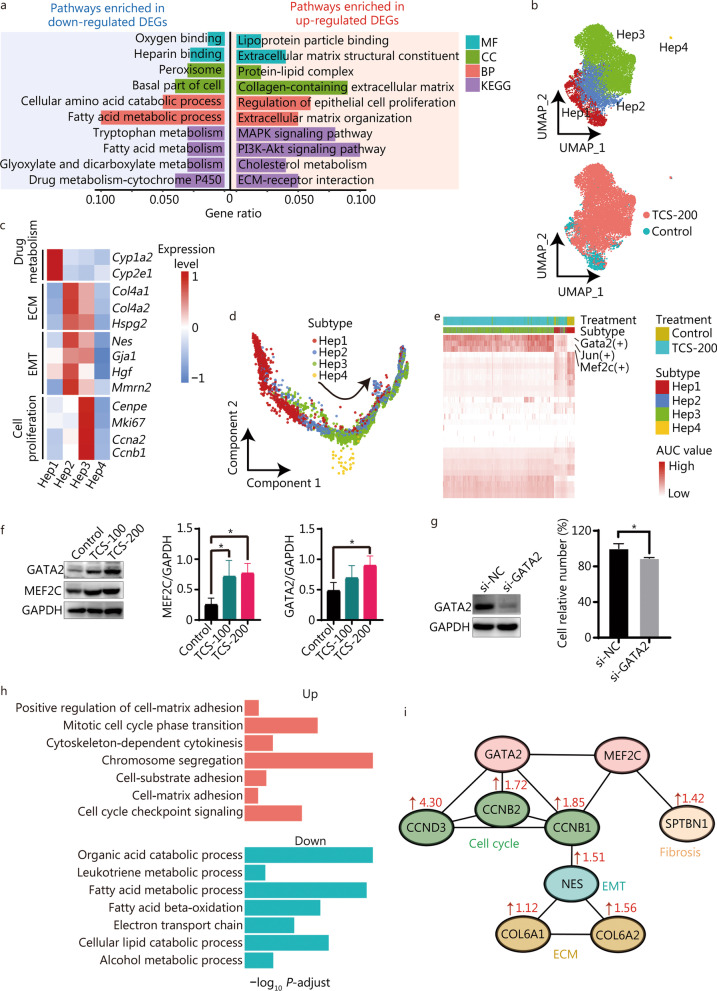
Fig. 3.
Heterogeneity of hepatocytes (Heps) and their differentiation states. a Functional enrichment in the down-regulated (left) and up-regulated (right) DEGs of TCS-200 group vs. control group. b UMAP visualization of distinct subtypes of Heps and their distributions in different groups. c Heatmap of expression levels of representative markers involved in drug metabolism, ECM, EMT and cell proliferation. d Pseudotime trajectory indicating the development of four subtypes, rooting from Hep1. e Heatmap showing AUC values of the expression levels of TFs in different subtypes. f The protein level of GATA2 and MEF2C in mice liver were detected by Western blotting. g Cell viability measured by CCK-8 assay after 72 h after transfection with si-NC for NC (normal control) or si-GATA2. h Bar plots showing the biological processes enrich up- and down-regulated DEPs after TCS treatment. i The potential regulatory relationship of GATA2 and MEF2C controlled downstream proteins leading to cell proliferation, ECM reorganization and liver fibrosis. Numbers indicate the fold change of protein between TCS-200 and control groups from proteomics dataset. TCS triclosan, DEGs differentially expressed genes, ECM extracellular matrix, MF molecular function, CC cellular component, BP biological process, KEGG Kyoto Encyclopedia of Genes and Genomes, AUC area under the curve, TF transcription factor, UMAP uniform manifold approximation and projection for dimension reduction, EMT epithelial-mesenchymal transition

