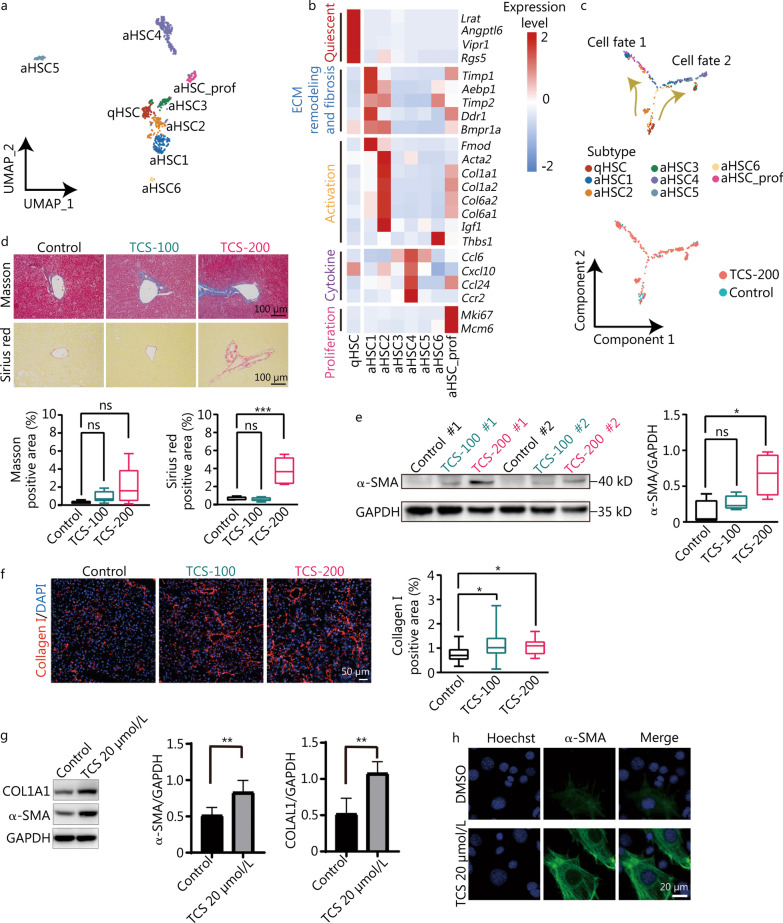
Fig. 4.
Transcriptomic roadmap of HSCs activation. a UMAP visualization of eight distinct subtypes of HSCs. b Heatmap of expression levels of representative markers related to cell quiescence, ECM remodeling and fibrosis, activation, cytokine and proliferation. c Pseudotime trajectory indicating the development of HSCs subtypes. Cell fate 1 represents trajectory from qHSC to aHSC1, cell fate 2 represents from qHSC to aHSC4. d Masson and Sirius red staining and the corresponding quantification of Masson- and Sirius red-positive areas (n = 5). Scale bar = 1000 μm. e Western blotting analysis of α-SMA expression levels in mice liver with or without TCS treatment, and the corresponding quantification of α-SMA protein expression levels, relative to GADPH loading control (n = 4). f Immunofluorescence staining of collagen I on mouse liver frozen sections (n = 4). The collagen I positive area was analyzed by ImageJ. Scale bar = 50 μm. g The protein expression of COL1A1 and α-SMA in LX-2 cells after TCS treatment. h Immunofluorescence staining of α-SMA in LX-2 cells after TCS or DMSO treatment. Scale bar = 20 μm. HSCs hepatic stellate cells, UMAP uniform manifold approximation and projection for dimension reduction, qHSC quiescent hepatic stellate cells, aHSC activated hepatic stellate cells, ECM extracellular matrix, TCS triclosan, α-SMA alpha smooth muscle actin, ns non-significant; *P < 0.05, **P < 0.01

