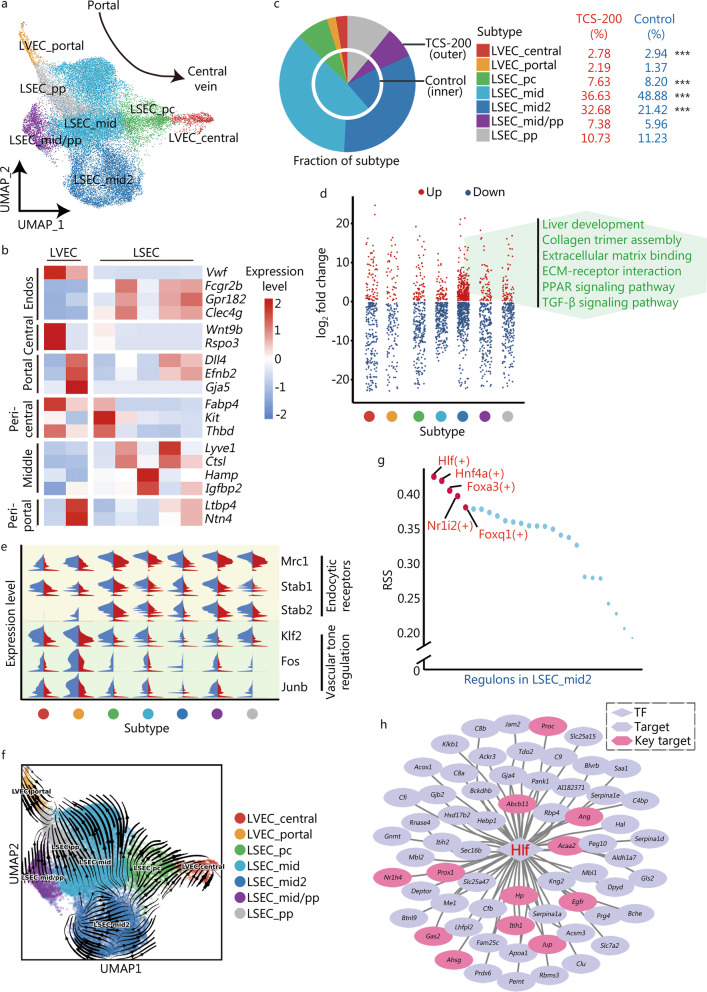
Fig. 5.
Distinct endothelial cells according to the spatial locations. a UMAP visualization of the 7 distinct subtypes of Endos based on spatial distribution. b Heatmap of the expression levels of representative markers indicating generalized Endos as well as central, pericentral, middle, periportal and portal position. c Pie chart showing the fraction of each endothelial subtype. d Strip chart showing DEGs of each subtype after TCS-200 treatment. The texts in green color represents the pathways enriched in the up-regulated DEGs in LSEC_mid2. e Split violin plot of the expression levels of genes associated with endocytic receptors and vascular tone regulation. f RNA velocity analysis of different subtypes of Endos, indicating LSEC capillarization. g Scatter diagram showing RSS of TFs in LSEC_mid2 subtype. The top 5 TFs ordered by scores were listed. h Transcription regulatory network constructed by Hlf and its target genes. Red text represents TFs, black text for targets (target), pink hexagon for genes related to ECM, tissue remodeling and response to hypoxia (key target). Endos endothelial cells, LVEC liver vascular endothelial cells, LSEC liver sinusoidal endothelial cells, UMAP uniform manifold approximation and projection for dimension reduction, DEGs differentially expressed genes, TCS triclosan, ECM extracellular matrix, RSS regulon specificity score, TFs transcription factors; ***P < 0.001

