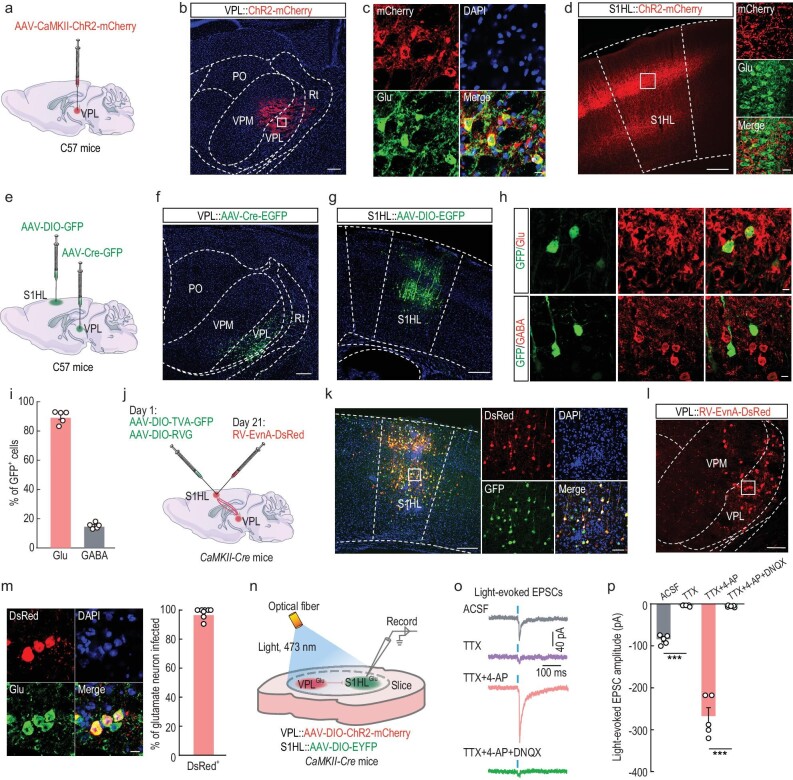
Figure 4.
Dissection of the VPLGlu→S1HLGlu circuit. (a) Schematic of viral injection. (b) Images showing that the injection site within the VPL by AAV-CaMKII-ChR2-mCherry. Scale bar, 200 μm. (c) Images showing ChR2-mCherry-labeled neurons (red) co-localized with glutamate immunofluorescence (Glu, green) within the VPL. Scale bar, 10 μm. (d) Representative images of mCherry+ fibers in the S1HL. Scale bars, 200 μm (left) or 20 μm (right). (e) Schematic of viral injection. (f and g) Representative images of viral expression within the VPL (f) and S1HL (g). Scale bars, 100 μm (f) or 200 μm (g). (h and i) Images (h) and statistical data showing that the majority of GFP-labeled neurons (green) within the S1HL are co-localized with glutamate immunofluorescence (Glu, red). Scale bar, 10 μm. (j) Schematic of the Cre-dependent retrograde trans-monosynaptic rabies virus tracing strategy in S1HLGlu neurons of CaMKII-Cre mice. (k) Representative images of the injected site (left) and viral expression (right) within the S1HL. Starter cells (yellow) co-expressing AAV-DIO-TVA-GFP, AAV-DIO-RVG (green), and rabies RV-EnvA-ΔG-DsRed (red). Scale bars, 200 μm (left) and 60 μm (right). (l) Typical images showing that DsRed+ neurons (red) within VPL traced from the S1HL. Scale bar, 100 μm. (m) Images (left) and summarized data (right) showing that the DsRed+ neurons co-localized with glutamate immunofluorescence. Scale bar, 10 μm. (n) Schematic of virus injection and the recording configuration. (o and p) Representative traces (o) and summarized data (p) showing light-evoked EPSCs recorded from ipsilateral S1HLGlu neurons held at −70 mV in the thalamocortical slices under the recording configuration shown in (n). All data are means ± SEM. ***P < 0.001. For detailed statistics information, see Table S1.

