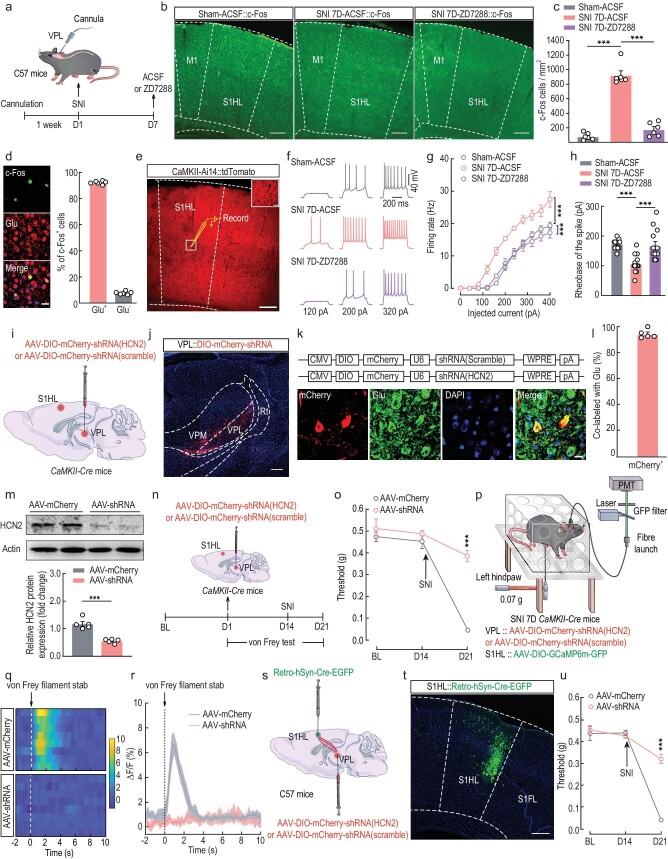
Figure 6.
Functional knockdown of HCN2 channels in the VPLGlu→S1HLGlu circuit rescues allodynia in SNI 7D mice. (a) Schematic of the experimental procedure. (b and c) Images (b) and statistical analysis (c) showing the distribution of c-Fos–positive neurons in the S1HL of sham and SNI 7D mice infused with ACSF or ZD7288 in the VPL. Scale bar, 200 μm. (d) Images (left) and statistical data (right) showing c-Fos–postive neurons (green) within S1HL were mainly co-labeled with glutamate immunofluorescence (Glu, red). Scale bar, 10 μm. (e) Electrophysiological recordings from tdTomato-expressing S1HLGlu neurons in CaMKII-Ai14 mice. Scale bar, 200 μm. The white box indicating the region shown in the box of the S1HL. Scale bar, 20 μm. (f and g) Sample traces (f) and summarized data (g) of current-evoked spike in S1HLGlu neurons recorded from sham and SNI 7D mice treated with ACSF or ZD7288 infusion into the VPL. (h) Summarized data of the rheobase of current-evoked spike in S1HLGlu neurons. (i) Schematic of viral injection. (j) Representative image showing the injection site within the VPL by AAV-DIO-mCherry-shRNA. Scale bar, 100 μm. (k) Top: schematic illustration of the construction strategy used for HCN2 channels downregulation with AAV-shRNA; Bottom: images showing mCherry-labeled neurons (red) co-localized with glutamate immunofluorescence (Glu, green) within the VPL. Scale bar, 10 μm. (l) Statistical data showing that mCherry-labeled neurons were mainly co-localized with glutamate immunofluorescence. (m) Western blotting of shRNA-scramble–infected and shRNA-HCN2–infected VPL lysates with antibodies against HCN2, β-actin. (n) Schematic of the experimental procedure. (o) Downregulation of HCN2 channels in VPLGlu neurons alleviated allodynia of SNI 7D mice. (p) Schematic of the fiber photometry recordings in SNI 7D mice. (q and r) Heatmaps (q) and the mean data (r) showing the change of S1HL-GluGCaMP6m signals in SNI 7D mice infusion of AAV-DIO-mCherry-shRNA (HCN2) or AAV-DIO-mCherry-shRNA (scramble) with the VPL. The colored bar at the right in (q) indicates ΔF/F (%). (s) Schematic of virus injection in the VPL and S1HL. (t) Typical image showing the injection site within the S1HL. Scale bar, 200 μm. (u) Effects of downregulation of HCN2 channels in VPLGlu→S1HLGlu pathway on pain thresholds in SNI 7D mice. All data are means ± SEM. ***P < 0.001. For detailed statistics information, see Table S1.

