
Fig. 1 |. Transfer of senescence by the old circulatory milieu in mouse and human cell cultures.
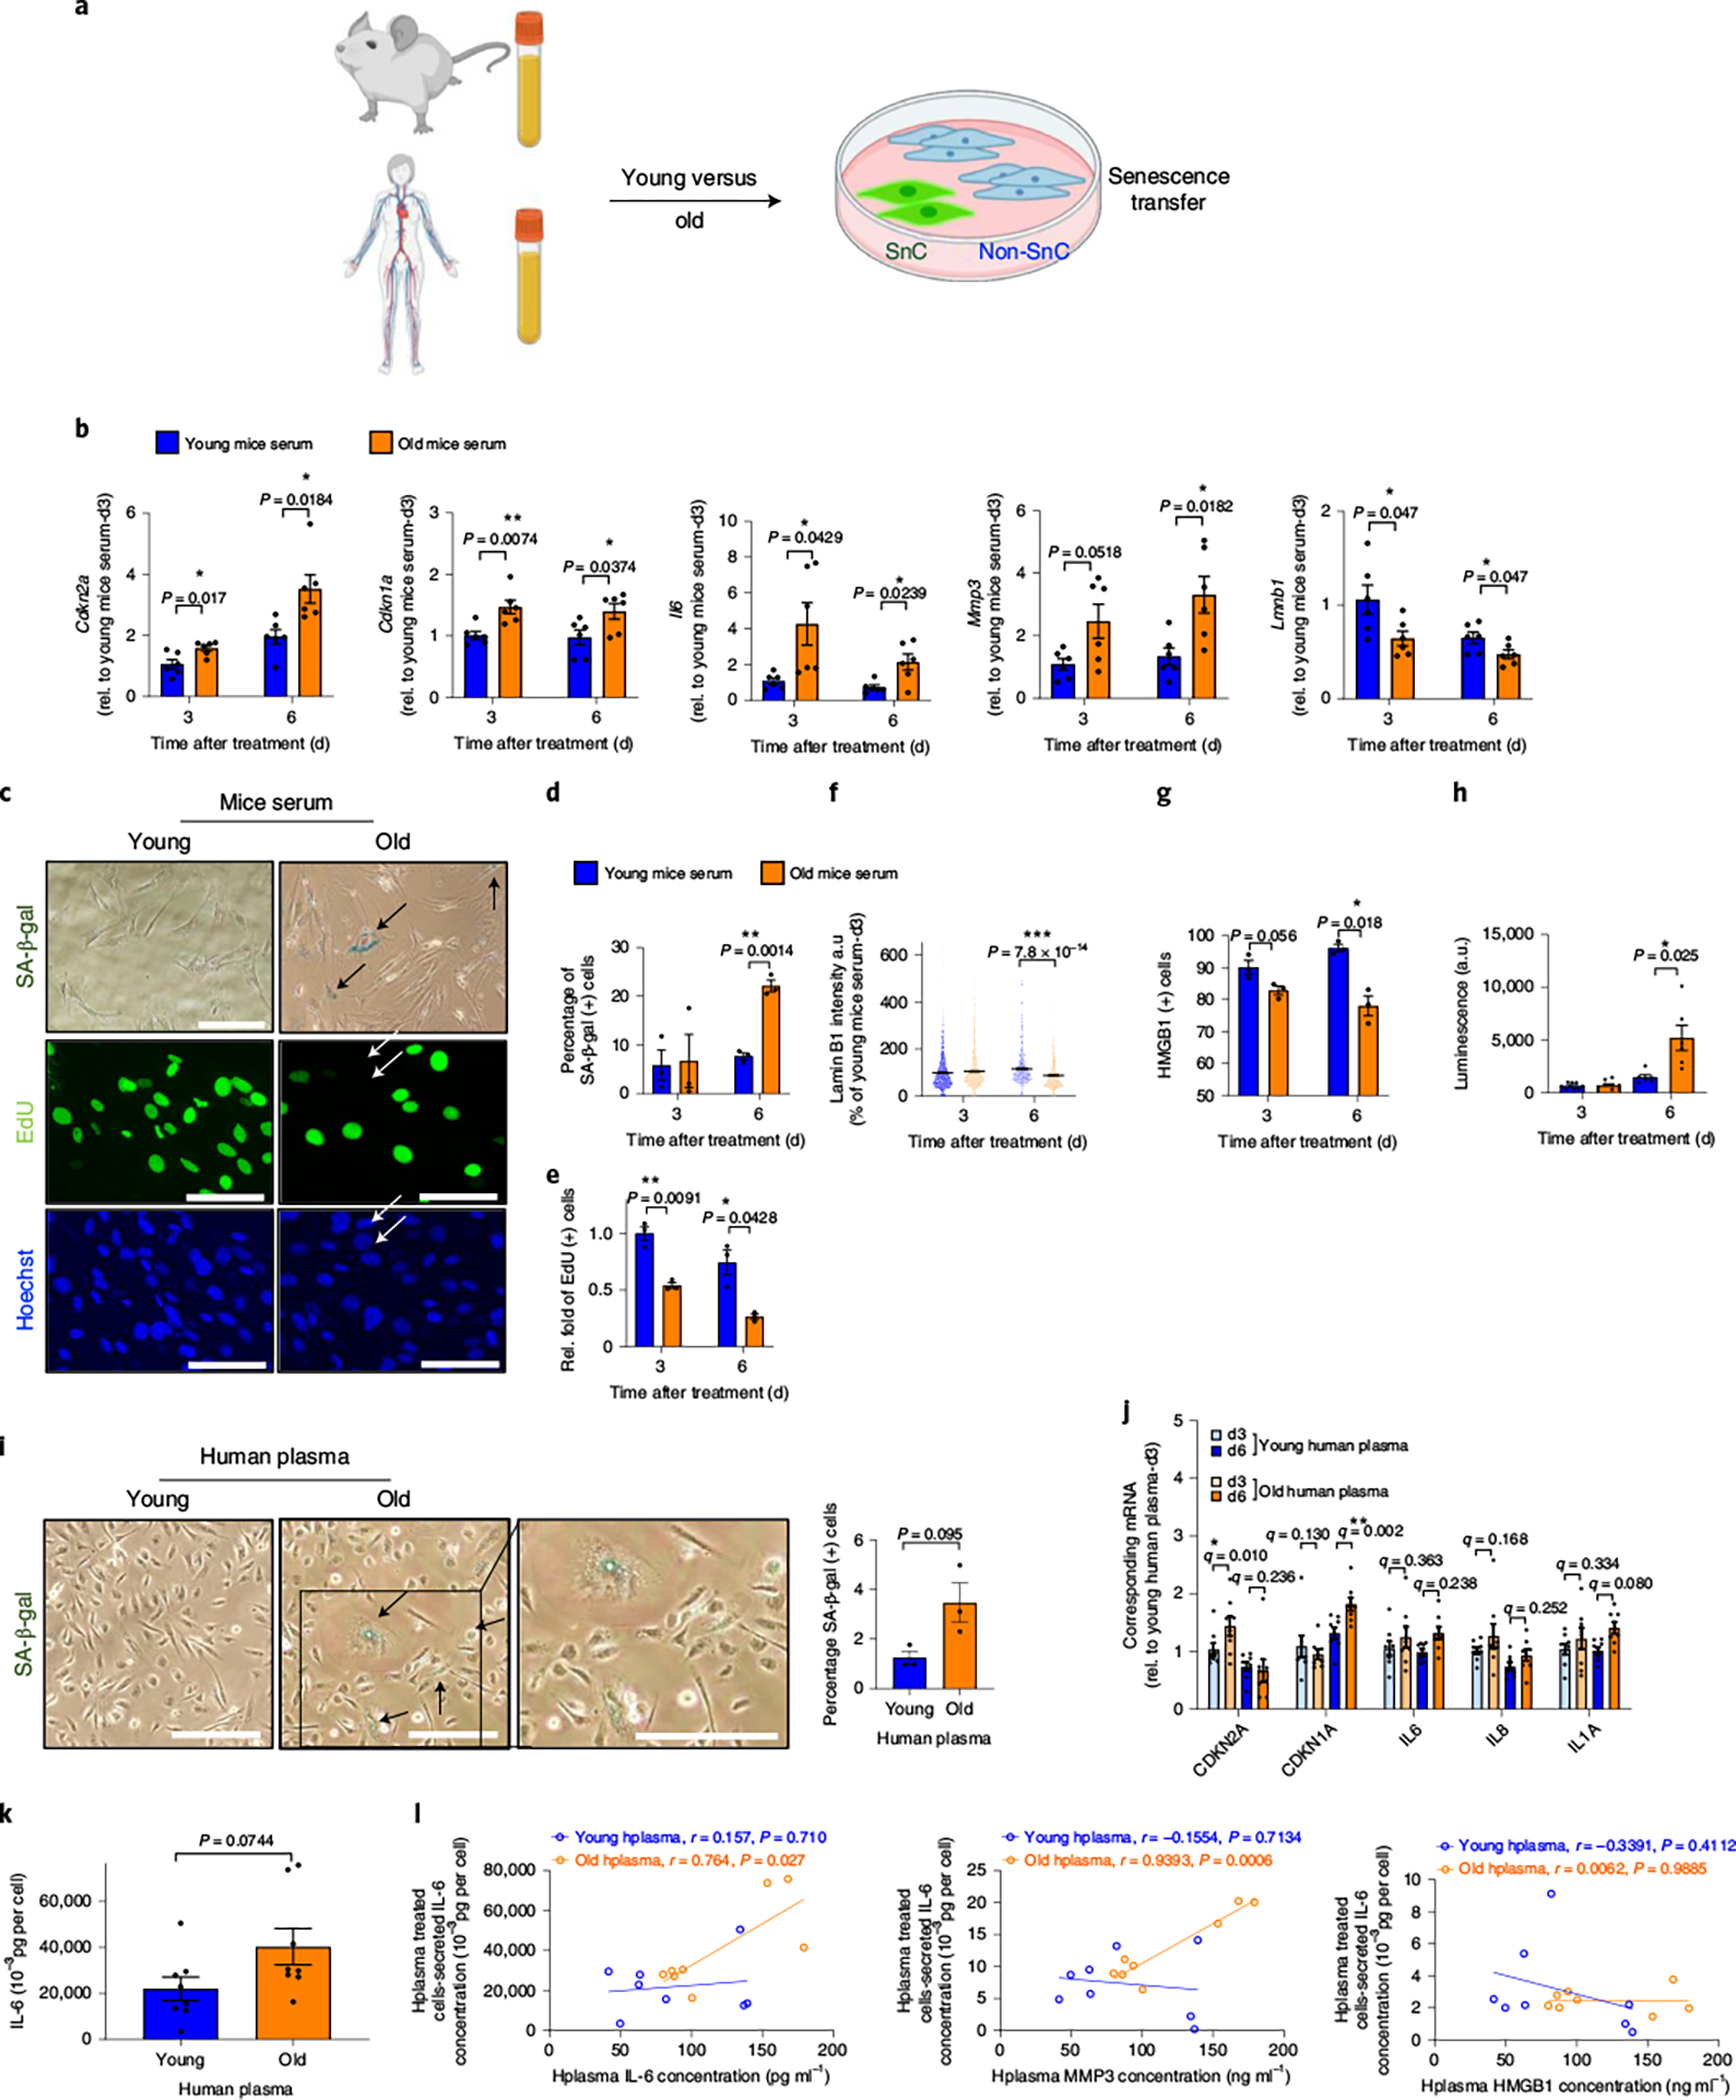
a, Outline of the studies. b, mRNA levels of Cdkn2a, Cdkn1a, Il6, Mmp3 and Lmnb1, normalized to Actb and Tub mRNA (n = 6 for each group). c, Representative SA-β-gal staining (SA-β-gal+ SnCs in arrows; n = 3 per group/three images per n), EdU (green, EdU negative non-proliferating SnCs in arrows; n = 3 for each group/5–6 images per n) and Hoechst labelled nuclei (blue). Scale bar, 100 μm. d–g, Quantification of the percentage of SA-β-gal+ cells (d), EdU+ cells (e), Lamin B1 levels, with around 1,000 cells (f) and HMGB1+ cells (n = 3 per group; at least 100 cells were counted) in MDFs 3 or 6 days after culturing in young or old mouse serum (g). h, Bioluminescence from p16-3MR-expressing cells in non-senescent MDFs cultured in serum from either young or old mice for 3 (n = 9 for each group) or 6 days (n = 6 for each group). i, Representative SA-β-gal staining (left; + cells are marked with arrows; n = 3 for each group/5–6 images per n) and percentage of SA-β-gal+ cells (right). j, Gene expression of senescence and SASP markers in human renal epithelial cells cultured with young or old human plasma for 3 or 6 days (d3 or d6; n = 8 per group). k, IL-6 level secreted by human renal epithelial cells treated with young or old human plasma for 6 days (n = 8 per group). l, Pearson correlation of secreted IL-6 levels by human renal epithelial cells treated with young or old human plasma and IL-6, MMP-3 and HMGB1 levels in human plasma (Pearson correlation coefficient and P are shown in the figures). Data are means ± s.e.m. of biologically independent samples. Statistical significance was calculated using a two-tailed t-test with a Welch’s correction (b,d–i,k) (*P < 0.05; **P < 0.01) and two-way ANOVA followed by two-stage step-up method by Benjamini, Krieger and Yekutieli, FDR < 0.05 (*q < 0.05; ** q < 0.01) (j). Rel, relative. Scale bars, 100 μm.