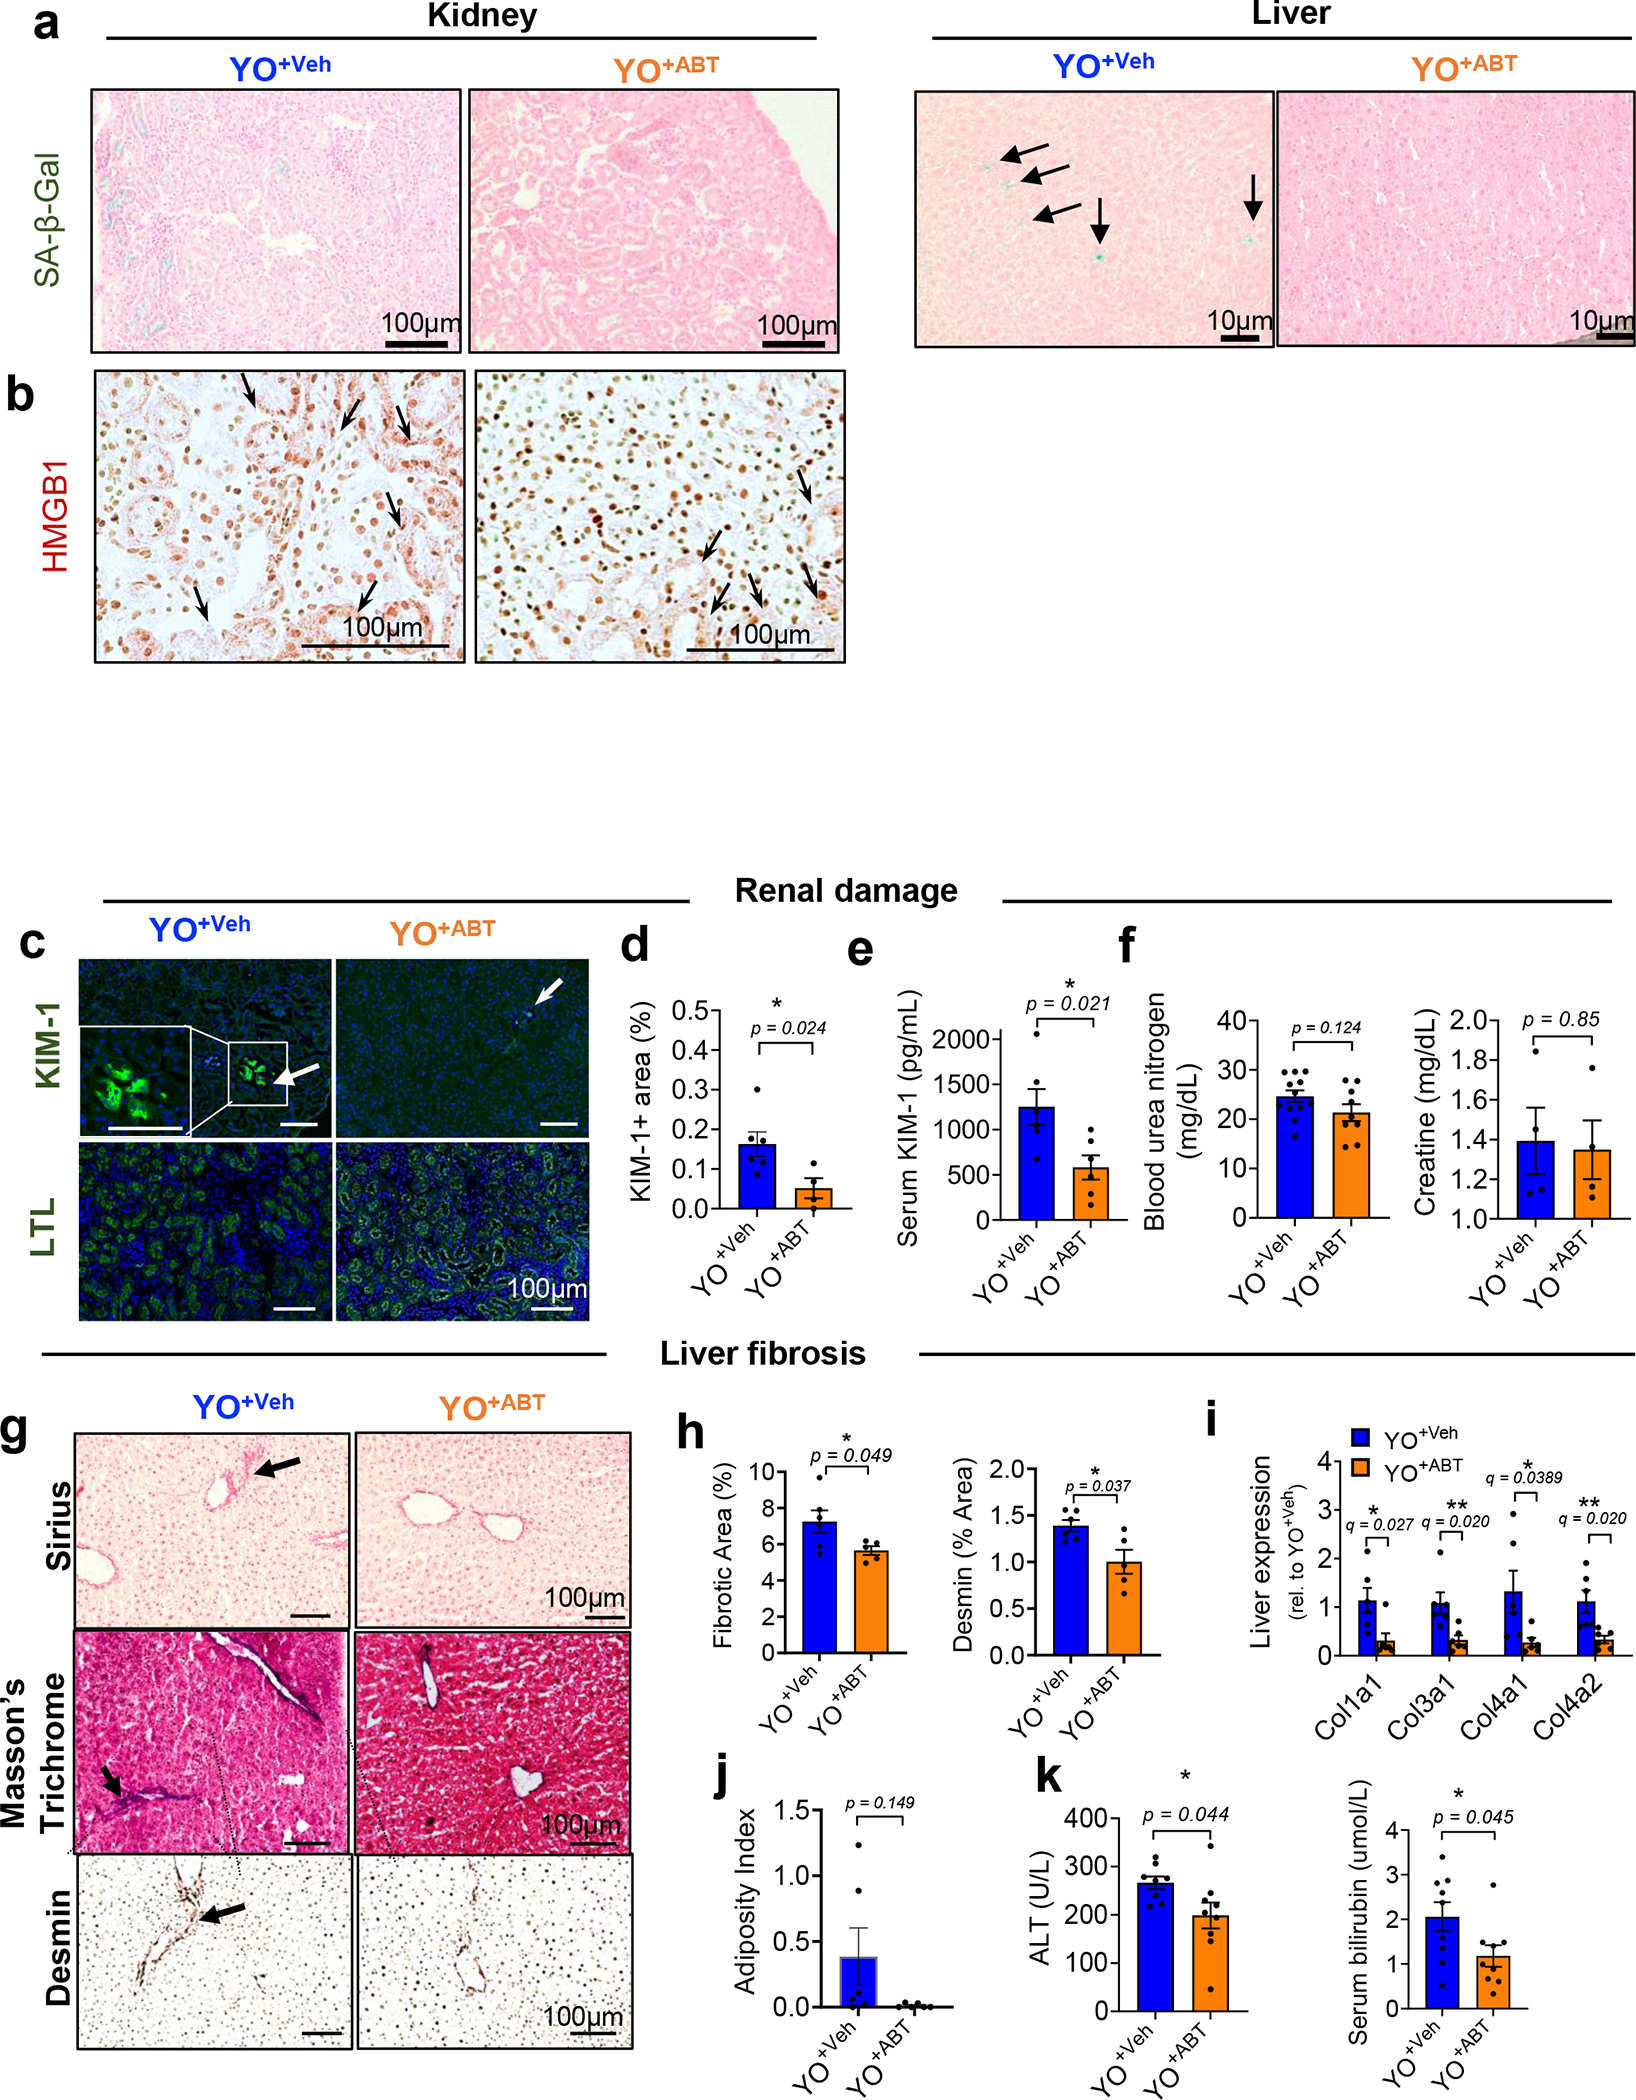
Extended Data Fig. 6 |. Removal of SnCs by ABT263 inhibits age-related tissue phenotypes induced by an aged circulation in kidney and liver young tissues.

(a) Additional SA-β-gal images of kidney (left) and liver (right) in young C57BL/6J mice receiving old C57BL/6 blood treated with vehicle (YO+Veh) or ABT263 (YO+ABT). (b) HMGB1 immunohistochemistry (brown staining of HMGB1 re-localized to cytoplasm of kidney cells with arrows) (n = 5 per group; 10–15 images per mice). (c) Immunohistochemical staining for KIM-1 (n = 6 for YO+Veh; n = 4 for YO+ABT; 4–5 images per mice) and LTL (n = 5 per group; 5–7 images per mice) on kidney tissues and (d) quantification of KIM-1 + area (%). (e) Serum concentration of KIM-1 (n = 6 per group), (f) blood urea nitrogen (n = 12 for YO+Veh; n = 9 for YO+ABT) and creatine (n = 4 per group). (g) Representative images of Sirius Red (n = 6 for YO+Veh; n = 5 for YO+ABT; 10–15 images per mice) and Masson Trichrom staining and desmin immunohistochemistry (n = 6 mice for YO+Veh; n = 5 mice for YO+ABT; 10–15 images per mice) in livers. Arrows indicate collagen deposition. (h) Quantifications of fibrotic area, as % of area occupied by Sirius Red stain, and desmin + area (n = 6 for YO+Veh; n = 5 for YO+ABT). (i) Quantification of mRNAs encoding Col1a1, Col3a1, Col4a1 and Col4a2 in the liver (n = 6 per group). (j) Oil Red O + area (%) indicated as adiposity index (n = 6 per group; 5–9 images per mice). (k) Serum analyses for ALT (n = 8 for YO+Veh; n = 9 for YO+ABT) and bilirubin (n = 9 per group). All data are expressed as means± s.e.m. of biologically independent samples. A two-tailed t test with a Welch’s correction (d-f, h, j-k; *, P < 0.05) and multiple t test with a two-stage linear step-up procedure of Benjamini, Krieger and Yekutieli, with Q = 5%, *q < 0.05; **q < 0.01 (i). Scale bars, 100 μm. Rel, relative.
