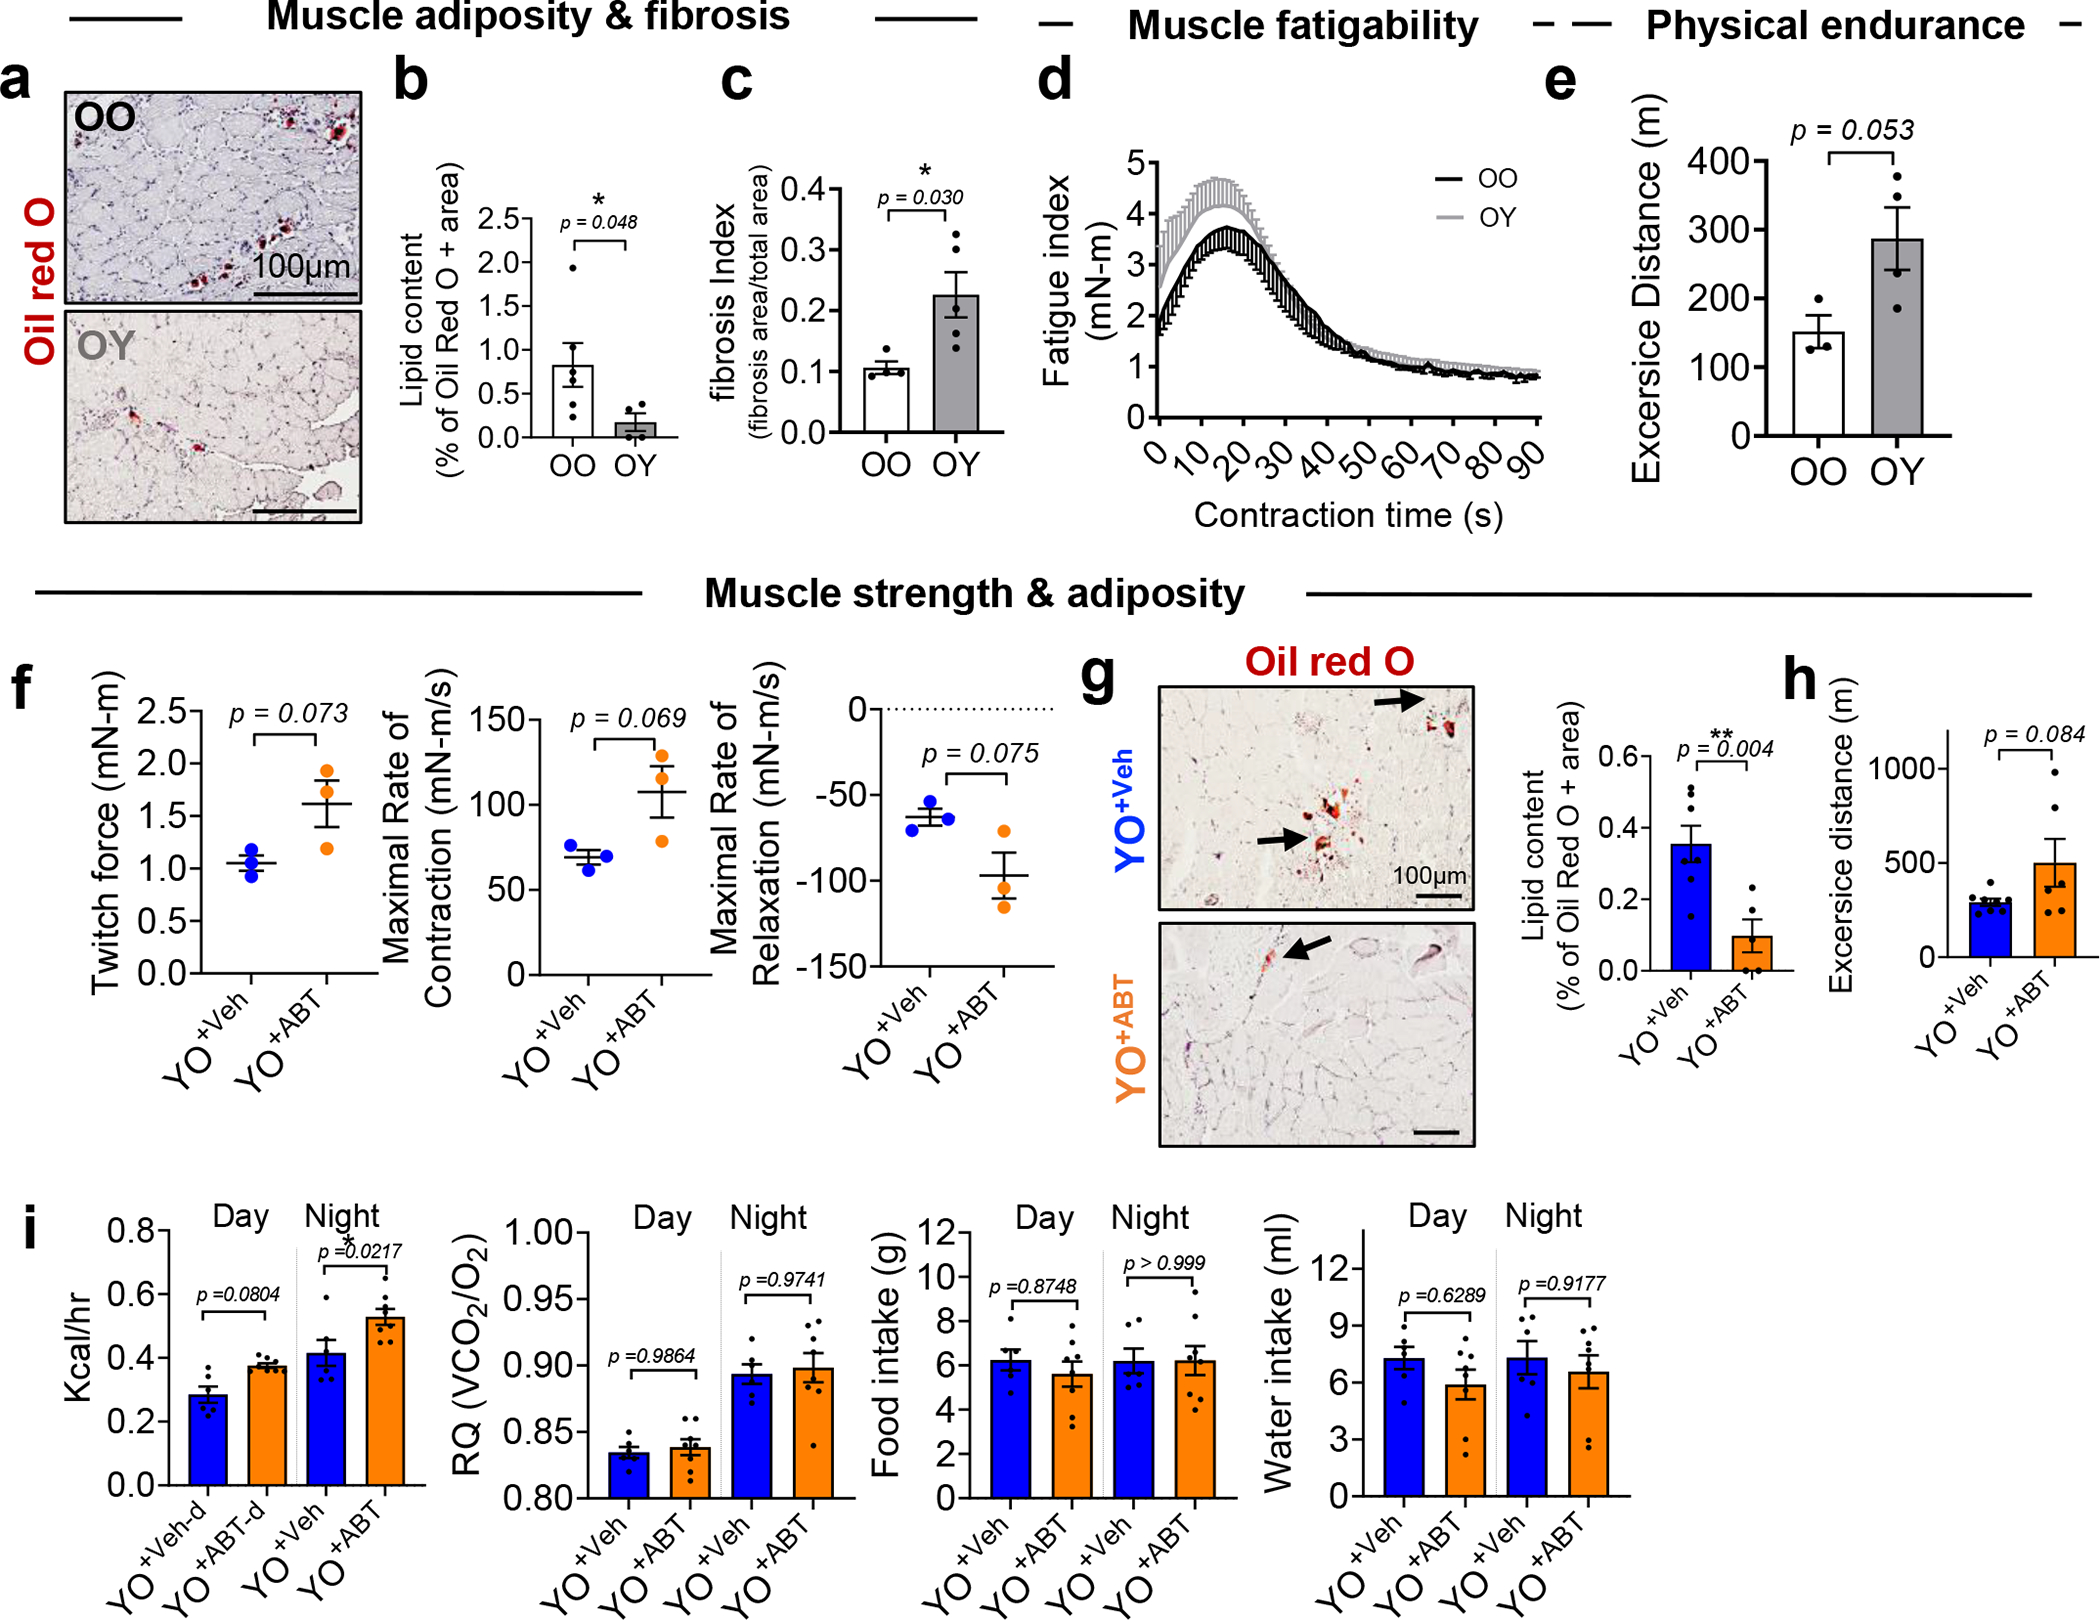
Extended Data Fig. 7 |. Abrogation of senescence induction by ABT263 treatment of old mice before heterochronic apheresis attenuates the negative effects of old blood on skeletal muscle function.

(a) Representative images of Oil Red O staining and (b) % of Oil Red O + area in muscles of old mice receiving old blood (OO) or young blood (OY) mice 14 days after blood exchange (n = 6 mice for OO; n = 4 mice for OY; 6–10 images per mice). (c) Fibrosis index, calculated from images of H&E staining (n = 4 for OO; n = 5 for OY; 3 images per mice). (d) Skeletal muscle fatigue assessment (n = 4 for OO; n = 3 for OY) and (e) treadmill running distance in meters (n = 3 for OO; n = 4 for OY). (f) Maximal twitch force generated by muscles and maximal rate of contraction between onset of contraction and peak force and maximal rate of relaxation ranging from peak force until force had declined to baseline during contractions in YO+Veh and YO+ABT (n = 3 per group). (g) Representative images of Oil Red O and quantification of Oil Red O + staining of skeletal muscles (n = 7 mice for YO+Veh; n = 5 mice for YO+ABT; 5–8 images per mice). (h) Running distance in meters of on treadmill (n = 8 for YO+Veh; n = 6 for YO+ABT). (i) Measured energy expenditure and respiratory quotient (RQ) to assess ratio of CO2 produced to O2 consumed and food intake in metabolic cages during the day and night cycles (n = 6 for YO+Veh; n = 8 for YO+ABT). Data are the average of 4 day and night cycles for 4 consecutive days. Data are means ± s.e.m. of biologically independent samples. A two-tailed t test with a Welch’s correction (b-c, e), Student t-test (f-h) (*, P < 0.05), and one-way ANOVA, Tukey’s multiple comparison test with *, P < 0.05 (i) was used for statistical analysis. Scale bars, 100 μm.
