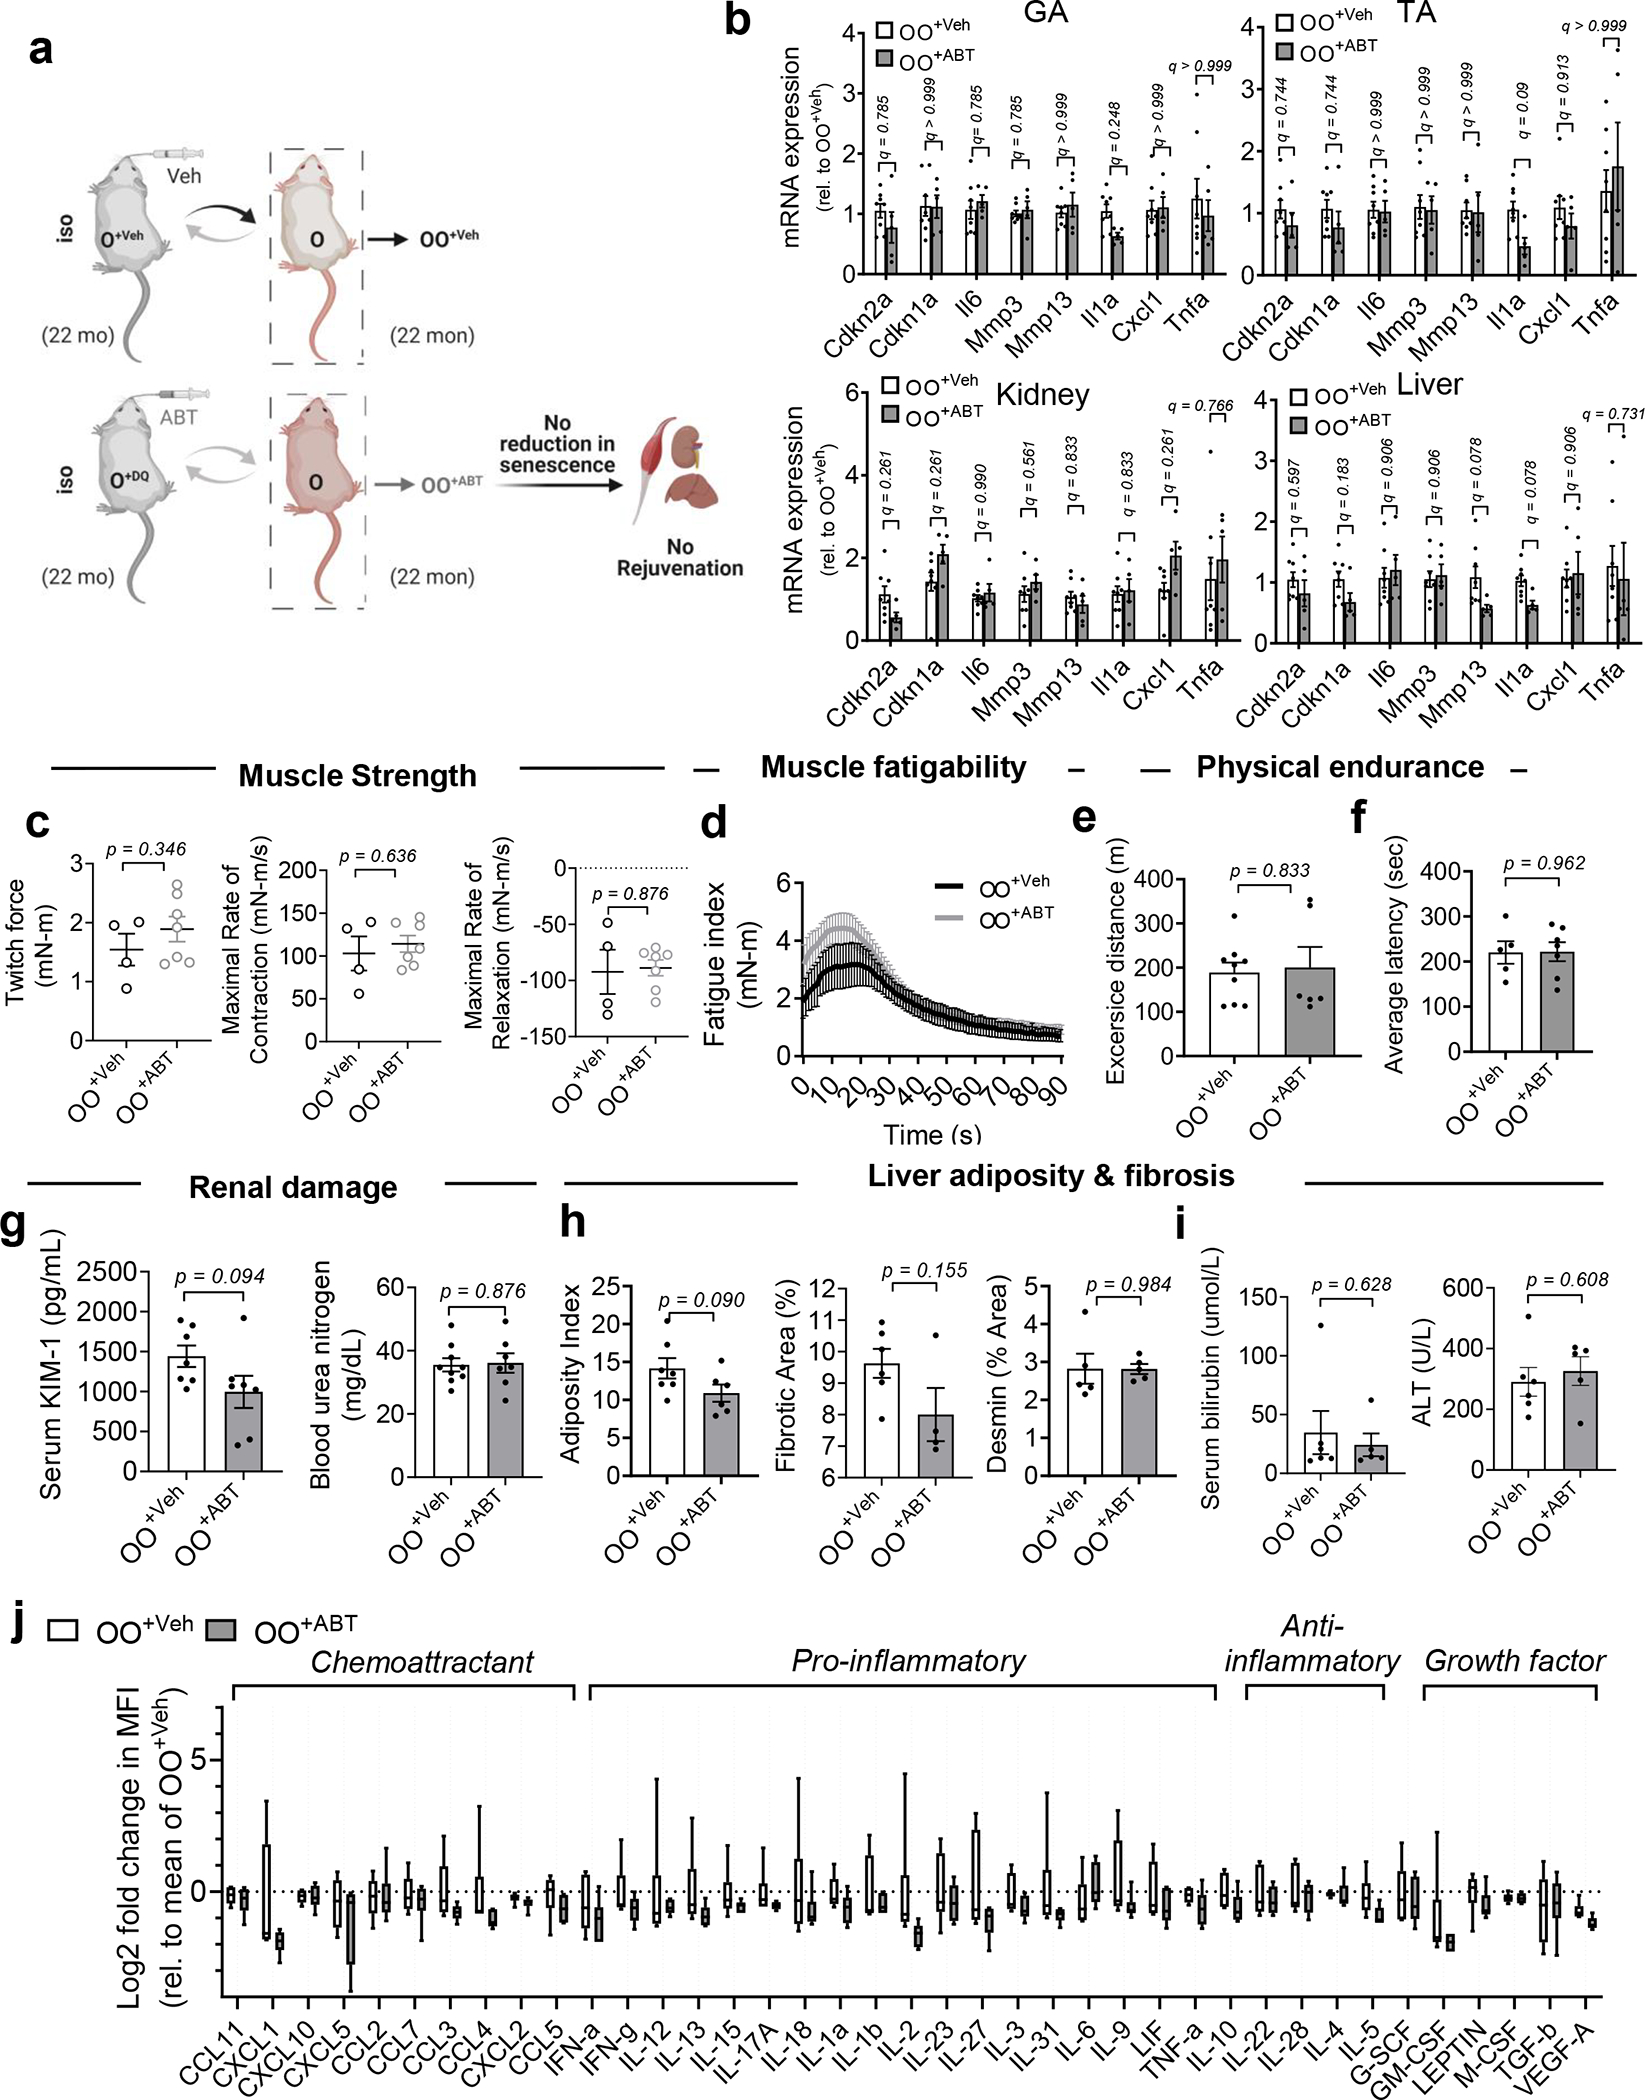
Extended Data Fig. 10 |. Systemic removal of SnCs by ABT263 in aged mice ablates rejuvenating effects by blood exchange.

(a) Schematic showing isochronic pairings using blood exchange. (b) Gene expression of senescence and SASP markers, in skeletal muscle (GA and TA), kidney and liver of old C57BL/6J mice receiving blood from old C57BL/6J mice treated with vehicle (OO+Veh) or ABT263 (OO+ABT) (n = 8 for OO+Veh; n = 5 for OO+ABT). (c) Absolute peak isometric torque of the plantarflexors, maximal rate of contraction between onset of contraction and peak force, and maximal rate of relaxation ranging from peak force until force had declined to baseline. (d) Skeletal muscle fatigue assessment (n = 4 for OO+Veh; n = 7 for OO+ABT). (e) Running distance in meters on treadmills (n = 9 for OO+Veh; n = 6 for OO+ABT). (f) Latency time to fall from the rotarod (n = 5 for OO+Veh; n = 7 for OO+ABT). (g) Serum analysis for KIM-1 (n = 7 for group) and blood urea nitrogen (n = 9 for OO+Veh; n = 7 for OO+ABT). (h) Adiposity (shown as a % of Oil Red O; n = 7 for OO+Veh; n = 6 for OO+ABT), collagen deposition (n = 5 for OO+Veh; n = 4 for OO+ABT), as the % of area occupied by Sirius Red stain, and desmin-positive-area (n = 5 for group). (i) Serum analysis for bilirubin and ALT (n = 6 for OO+Veh; n = 5 for OO+ABT). (j) Box-and-whisker plots of log2-transformed fold change in MFI compared to the average of OO+Veh. Box plots depict median, with whiskers indicating 10–90 percentile values (n = 6 for each group). Data are means ± s.e.m. Data are collective of two independent experiments. Multiple Mann-Whitney tests with a two-stage linear step-up procedure of Benjamini, Krieger and Yekutieli, with Q = 5% (*q < 0.05; **q < 0.01) (b, j) and two-tailed t test with Welch’s correction, with *P < 0.05 (c, e-i) was used for statistical analysis. Rel, relative.
