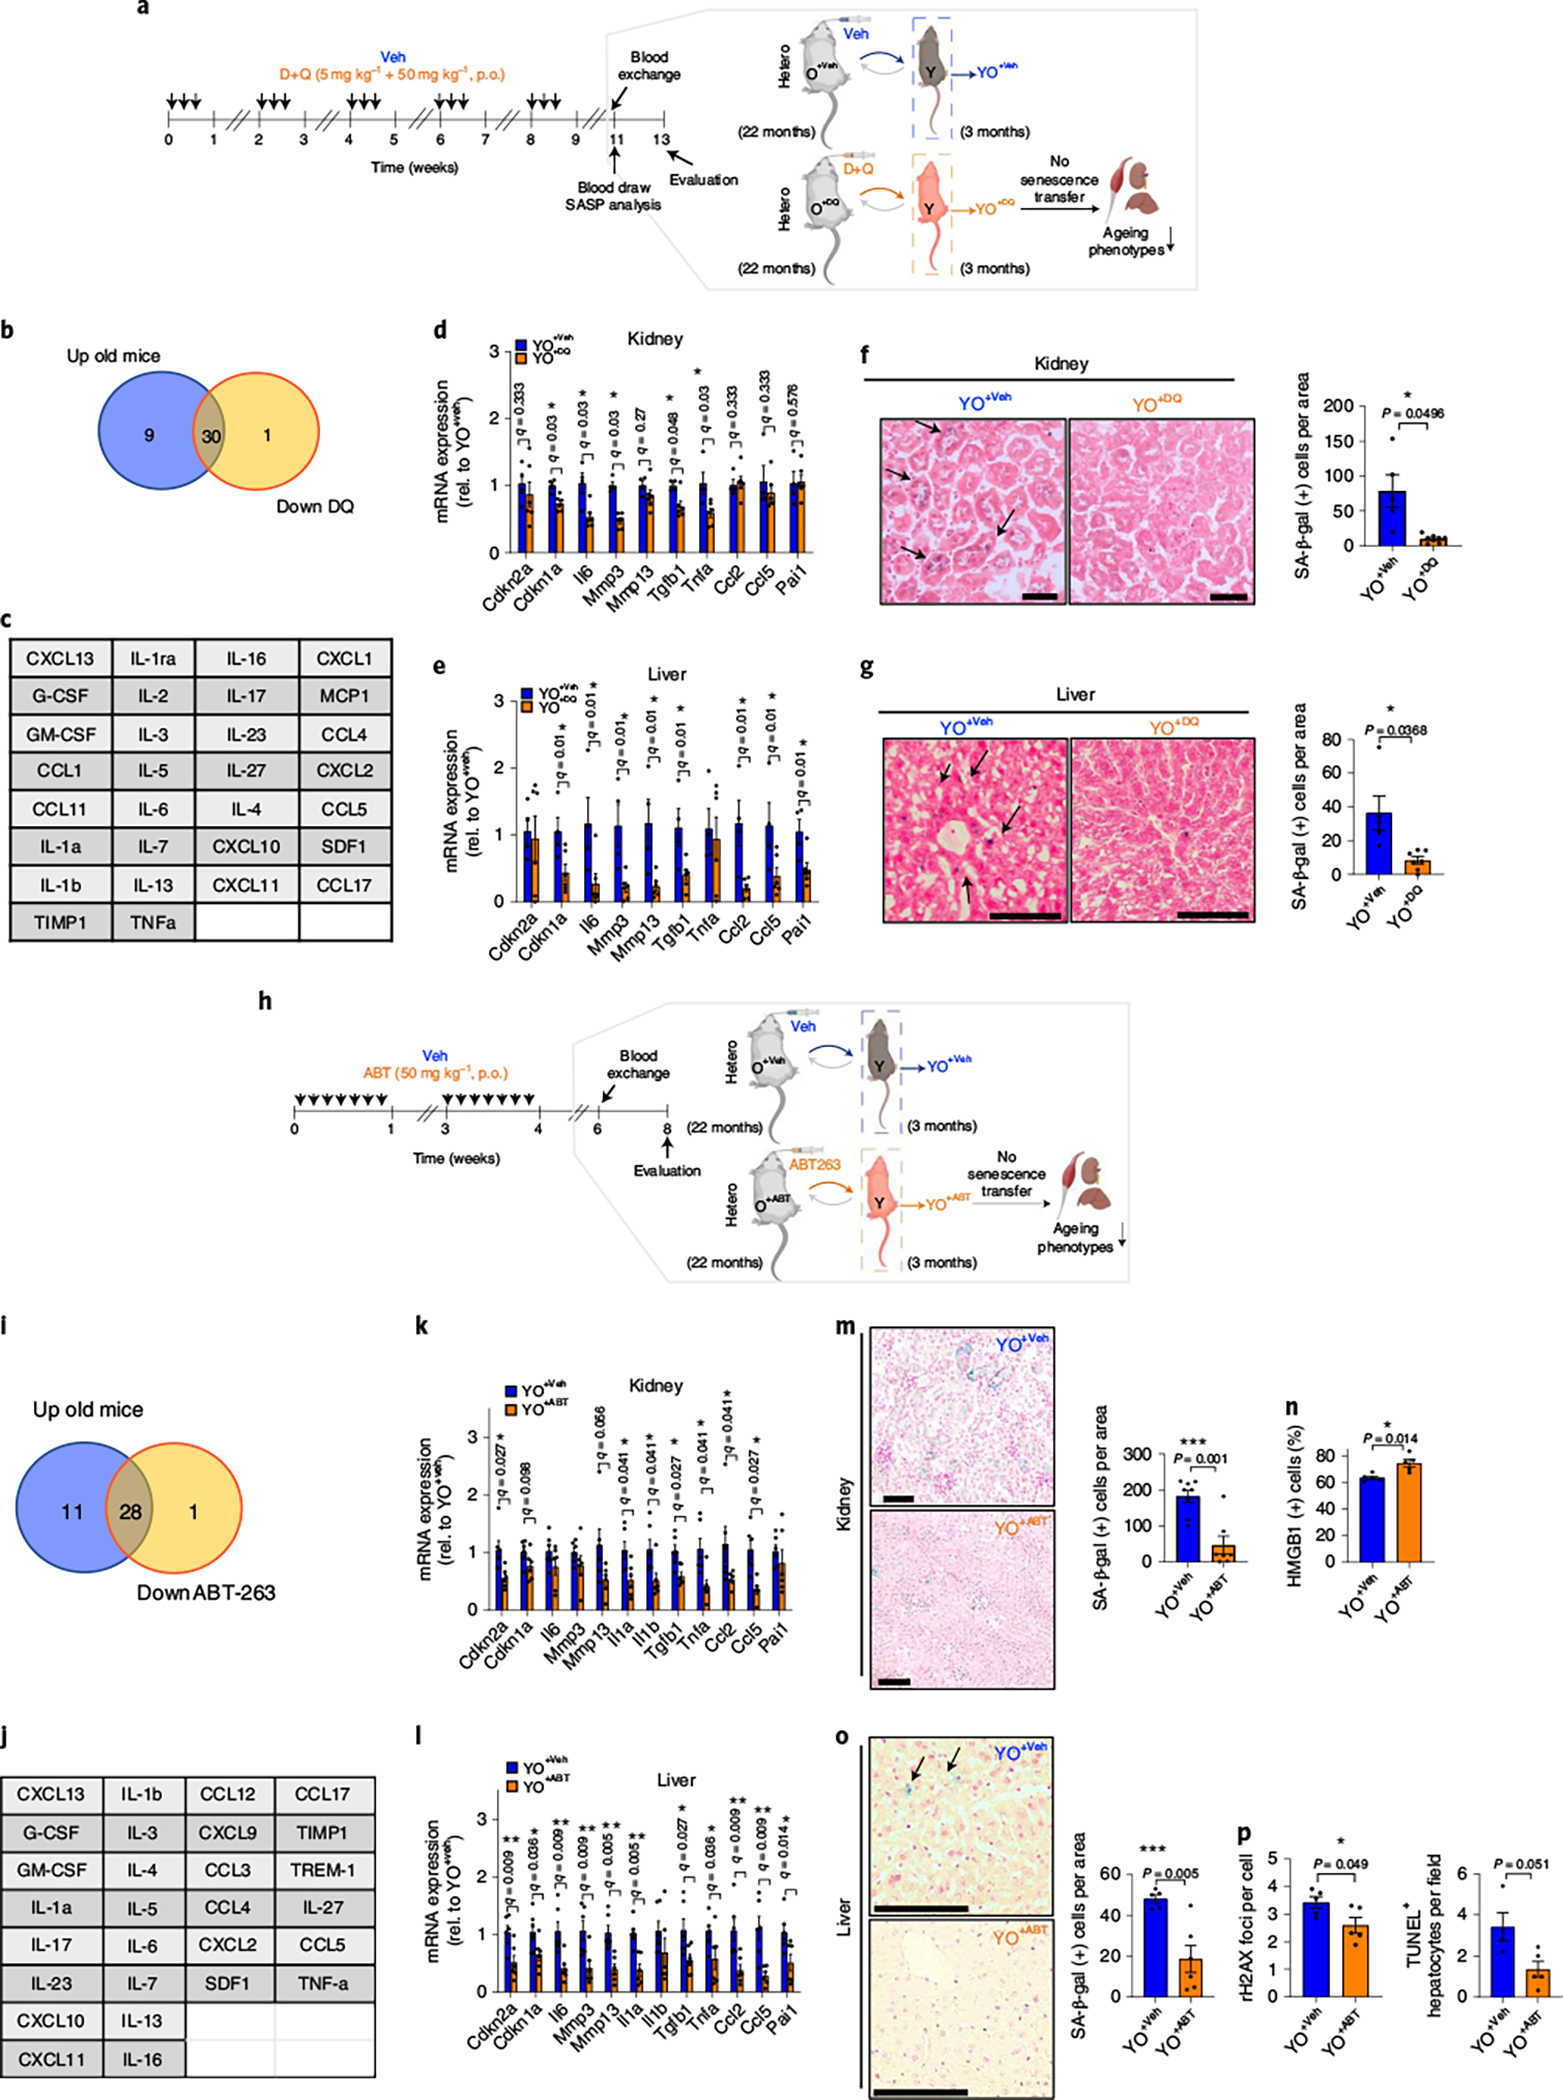
Fig. 3 |. Senolytics blunts the ability of the aged circulation to induce senescence transfer in young kidney and liver tissues.

a, Study design used in b–g. b, Venn diagram showing the overlap between up-regulated circulating SASP proteins identified in old versus young mice (>1.5-fold) and down-regulated proteins in vehicle (Veh)-treated versus DQ-treated old mice (<0.7-fold). c, List of overlapping proteins in b. d,e, Senescence/SASP-associated gene expression in kidney (d) and liver (e) of young mice receiving old blood treated with Veh (YO+Veh; n = 4) or DQ (YO+DQ; n = 6). f,g, Representative SA-β-gal staining (n = 5 for YO+Veh; n = 7 for YO+DQ; 10–15 images per mouse) and quantification of SA-β-gal+ cells per area in kidney (f) and liver (g) (n = 5 for YO+Veh; n = 8 for YO+DQ; 7–10 images per mouse). h, Study design used in i–p. i, Venn diagram showing the overlap between up-regulated circulating SASP proteins in old versus young mice (>1.5-fold) and down-regulated proteins in Veh-treated versus ABT263-treated old mice (<0.7-fold). j, List of overlapping proteins in i. k–l, Senescence/SASP-associated gene expression in kidney and liver of young mice receiving old blood treated with Veh (YO+Veh) or ABT263 (YO+ABT) (n = 6 per group). m,n, Representative images of SA-β-gal staining in kidney (n = 8 for YO+Veh; n = 7 for YO+ABT; 6–10 images per mouse) and quantification of SA-β-gal+ cells per area (m) and HMGB1+ tubular cells (n). Scale bar, 500 μm. o,p, Images of SA-β-gal staining in liver (n = 5 for YO+Veh; n = 6 for YO+ABT; ten images per mouse) and quantification of SA-β-gal+ cells per area (o), γ-H2AX foci (n = 5 per group; 6–8 images per mouse) and TUNEL+ hepatocytes (n = 4 for YO+Veh; n = 5 for YO+ABT; 5–9 images per mouse) (p). Scale bar, 100 μm. Two independent experiments were performed. Data are means ± s.e.m. of biologically independent samples. Statistical significance was calculated using multiple Mann–Whitney tests with a two-stage linear step-up procedure of Benjamini, Krieger and Yekutieli, with Q = 5%, *q < 0.05 (d,e,k,l) and a two-tailed t-test with a Welch’s correction (f,g,m–p) with *P < 0.05; **P < 0.01; ***P < 0.001. Rel, relative.
