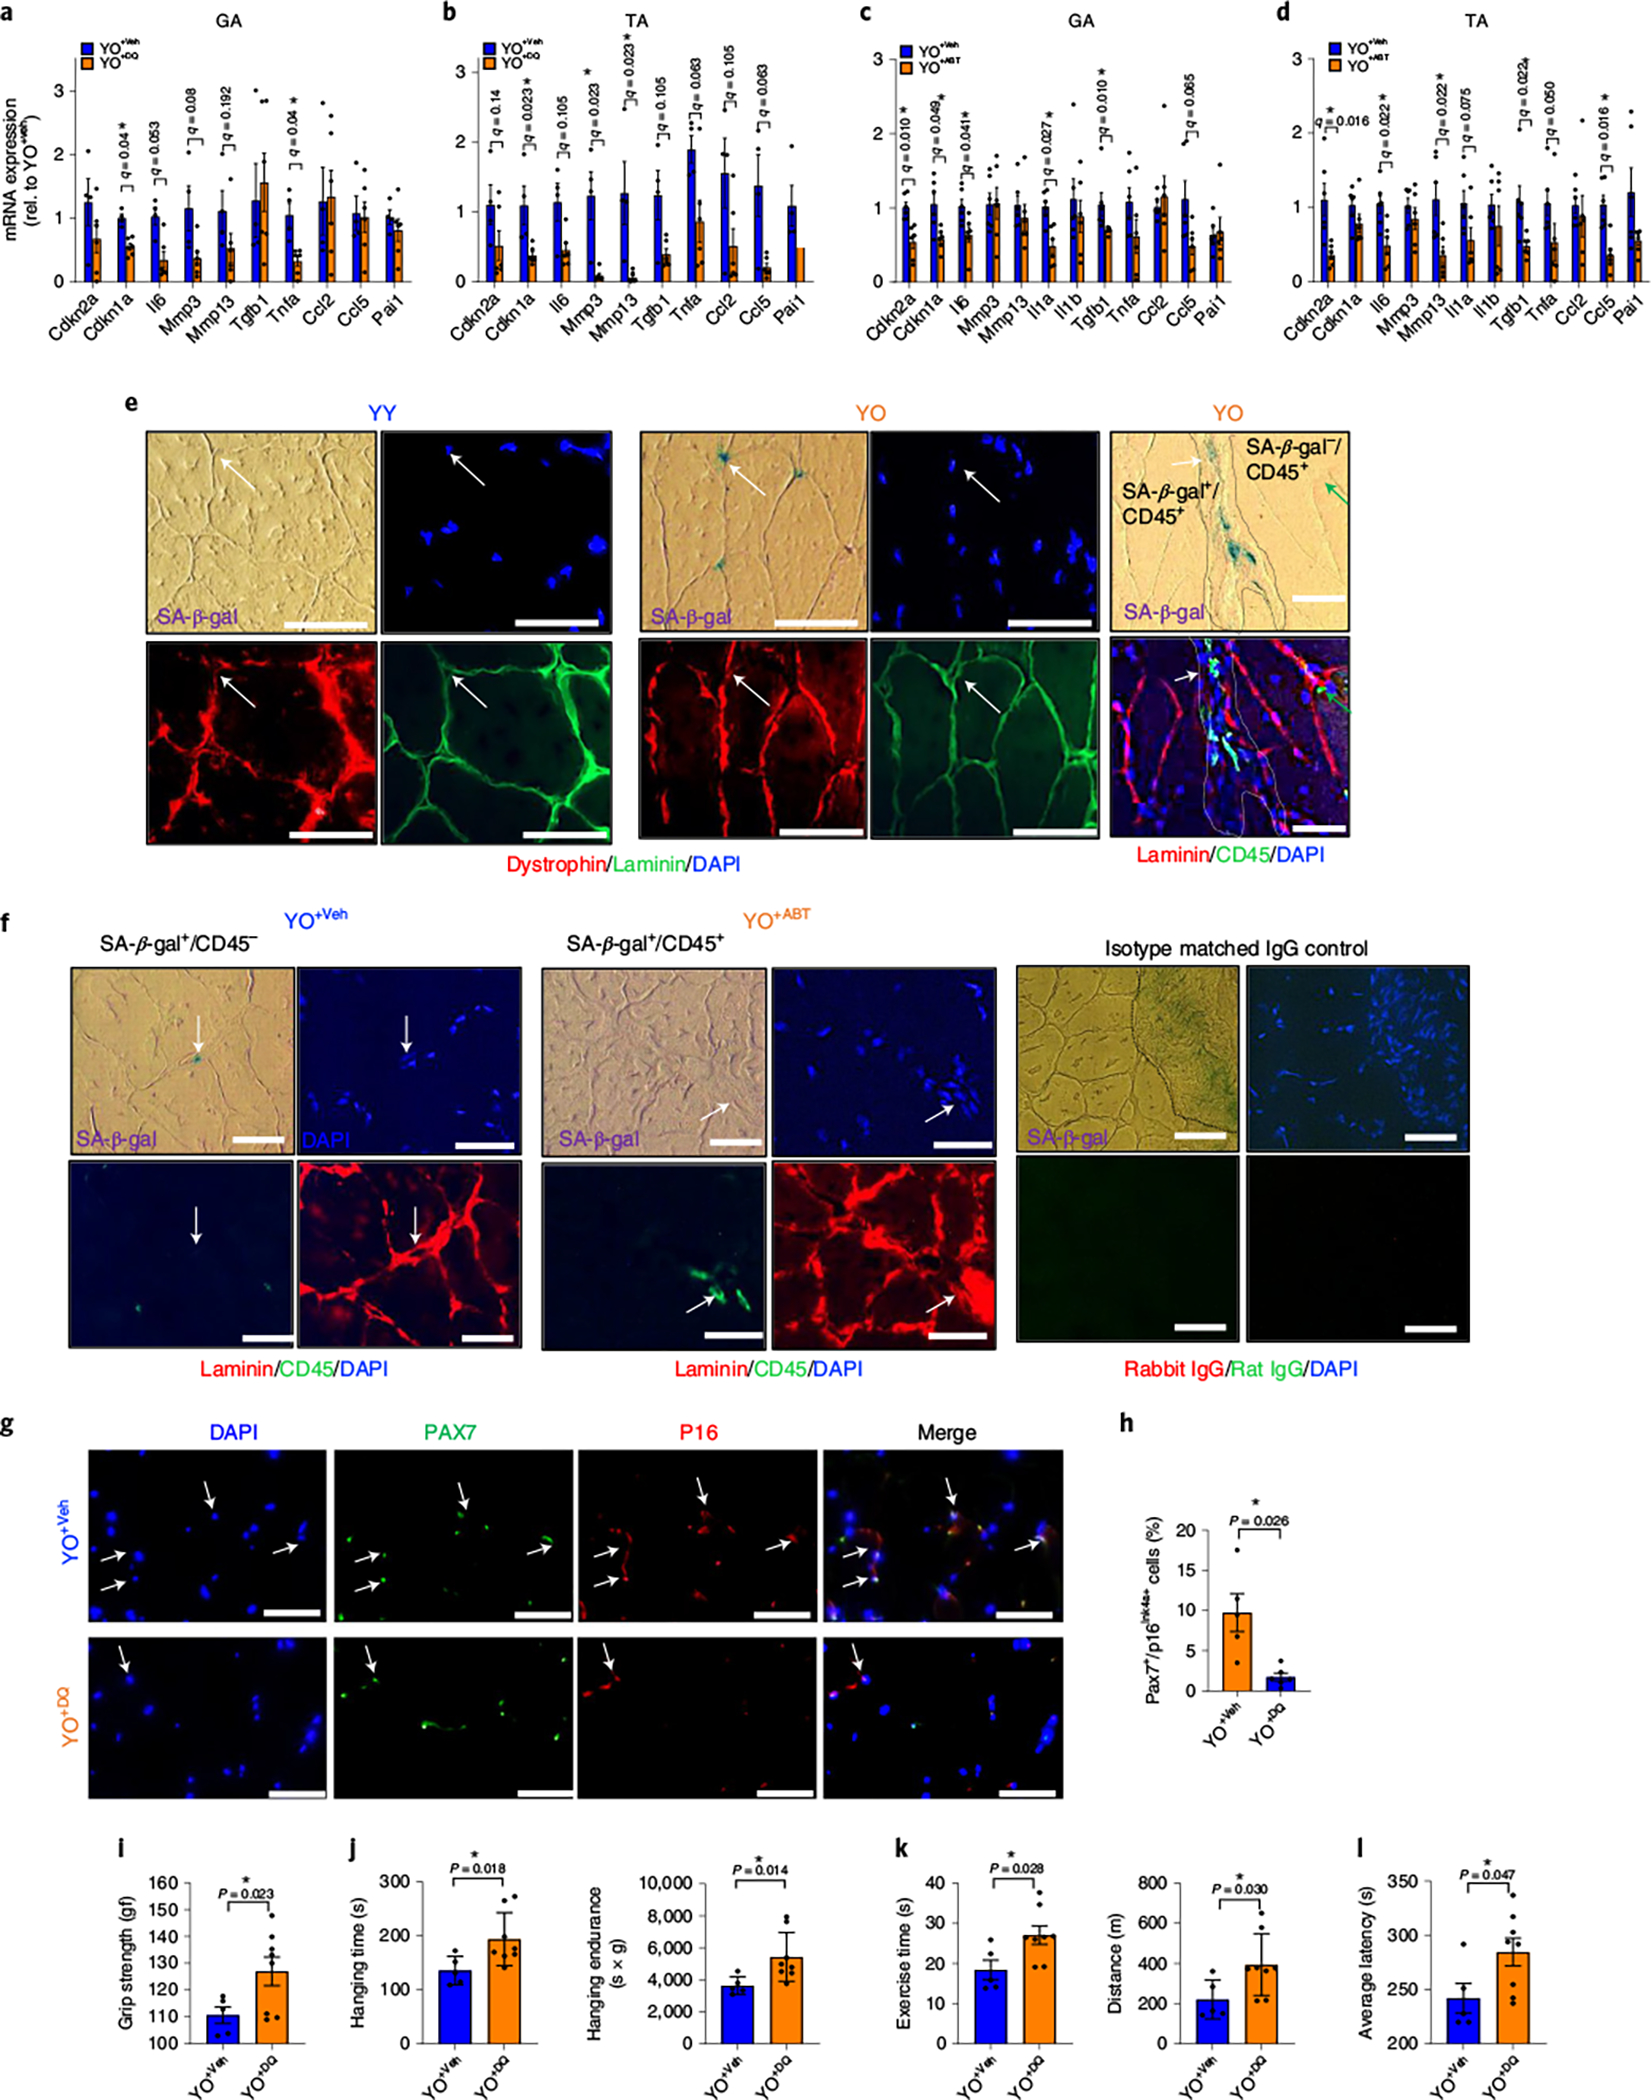
Fig. 4 |. Treatment of old mice with senolytics before the blood exchange attenuates the negative effects on young skeletal muscle.

a–d, Expression of senescence and SASP markers by RT–PCR in muscles (gastrocnemius (GA) (a) and tibialis anterior (TA) (b)) of young mice receiving old blood treated with DQ (YO+DQ; n = 6) or vehicle control (YO+Veh; n = 4) and in GA (c) and TA (d) of young mice receiving old blood treated with ABT263 (YO+ABT; n = 6) or vehicle control (YO+Veh; n = 6). e, Representative images of costaining for SA-β-gal/laminin/dystrophin or SA-β-gal/laminin/CD45 (pan-leukocyte marker) in the same section of young skeletal muscle after exchanging blood from either young (YY) or old (YO) C57BL/6J mice (three mice per group/4–5 images per mouse). Arrows point to the same cells in SA-β gal-phase, DAPI and laminin/dystrophin images. In the rightmost panels of e, white arrow points to SA-β gal+/CD45+ cells and green arrow points to SA-β gal−/CD45+ cells in the DAPI and laminin/CD45 images. f, Costaining for SA-β-gal/laminin/CD45 in the same section of (n = 5 mice for YO+Veh; n = 7 mice for YO+ABT/three images per mouse). Isotype matched negative IgG control for these immunofluorescence assays is shown in the rightmost panels; the non-specific fluorescence is minimal to non-existent. g, Immunofluorescence for p16 and Pax7 protein in the muscles of YO+Veh and YO+DQ mice (n = 5 for YO+Veh; n = 7 for YO+DQ/five images per mouse). h, Percentage of Pax7 and p16 double plus cells in g. i–l, Grip strength (i), hang time and endurance (j), treadmill running time and distance (k) and latency time (l) to fall from the rotarod in YO+Veh (n = 5) or YO+DQ (n = 8). All data are expressed as means ± s.e.m. of biologically independent samples and each data point represents an individual mouse. Statistical significance was calculated using multiple Mann–Whitney tests with a two-stage linear step-up procedure by Benjamini, Krieger and Yekutieli, with Q = 5%, *q < 0.05 (a–d) and a two-tailed t-test with a Welch’s correction (h,i–l), with *P < 0.05. Scale bars, 50 μm. Rel, relative.
