
Extended Data Fig. 4 |. Inhibition of age-related tissue phenotypes induced by aged circulation in kidney and liver of young animals after exchanging blood of old mice in which SnCs were removed by DQ.
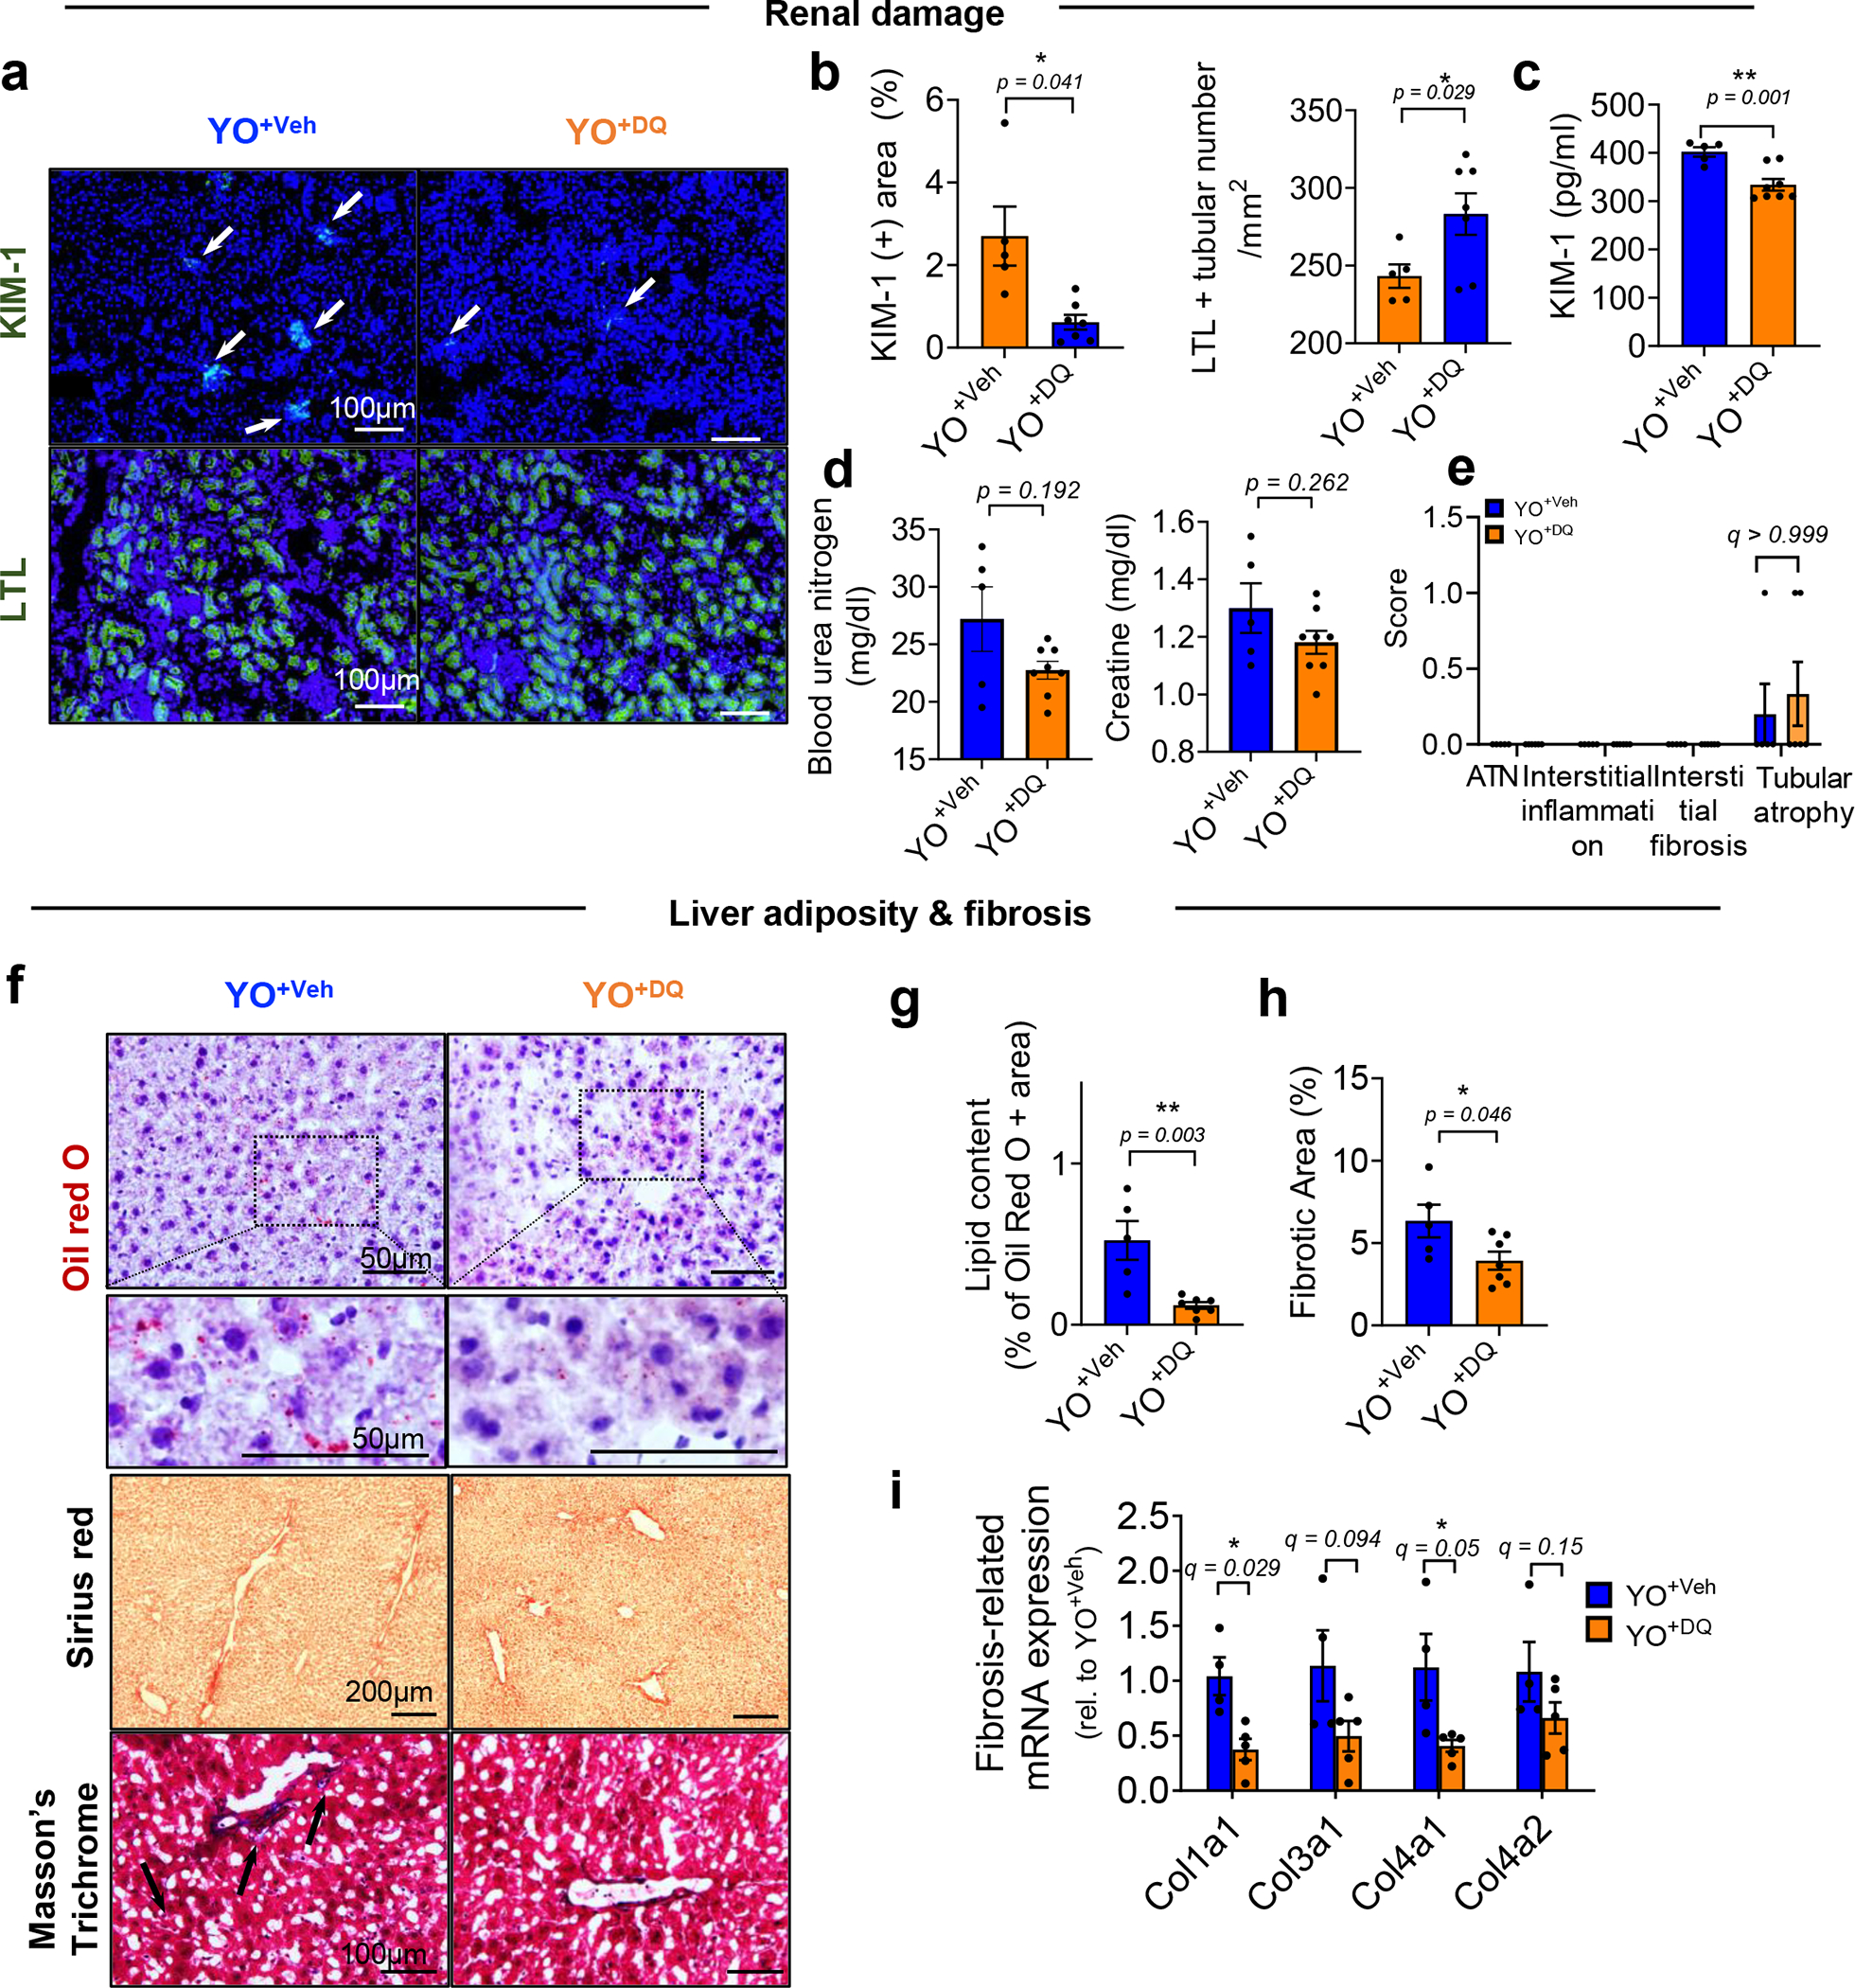
(a) Representative images of KIM-1 (n = 5 mice for YO+Veh; n = 7 mice for YO+DQ / 6–10 images per mice) and LTL (n = 5 mice for YO+Veh; n = 7 mice for YO+DQ / 6–8 images per mice) and (b) quantification of KIM-1 positive area (%) and LTL + tubular number as a marker of healthy renal tubules. (c) Measurements of KIM-1 levels and (d) blood urea nitrogen and creatine in serum of YO+Veh (n = 5) and YO+DQ mice (n = 8). (e) Scores of ATN, interstitial inflammation, interstitial fibrosis and tubular atrophy of renal cortex (n = 5 for YO+Veh; n = 6 for YO+DQ). (f) Representative images of Oil red O (n = 5 mice for YO+Veh; n = 7 mice for YO+DQ / 8–15 images per mice), Sirius red (n = 5 mice for YO+Veh; n = 7 mice for YO+DQ; 10–15 images per mice) and Masson’s Trichrom (n = 4 for YO+Veh; n = 5 for YO+DQ; 15–20 images per mice) staining and (g-h) quantification of Oil Red O-positive and fibrotic areas. (i) Quantification of fibrosis-related mRNAs encoding Col1a1, Col3a1, Col4a1, and Col4a2 in the liver (n = 4 for YO+Veh; n = 5 for YO+DQ). Data are means ± s.e.m. of biologically independent samples and each data point represents an individual mouse. A two-tailed t test with a Welch’s correction (b-d), Student’s t test (g-h) with *, P < 0.05; **, P < 0.01, multiple Mann-Whitney tests (e) and multiple t-tests (i) with a two-stage linear step-up procedure of Benjamini, Krieger and Yekutieli, with Q = 5%, *q < 0.05 was used for statistical analysis. Scale bars are shown in each image. Rel, relative.