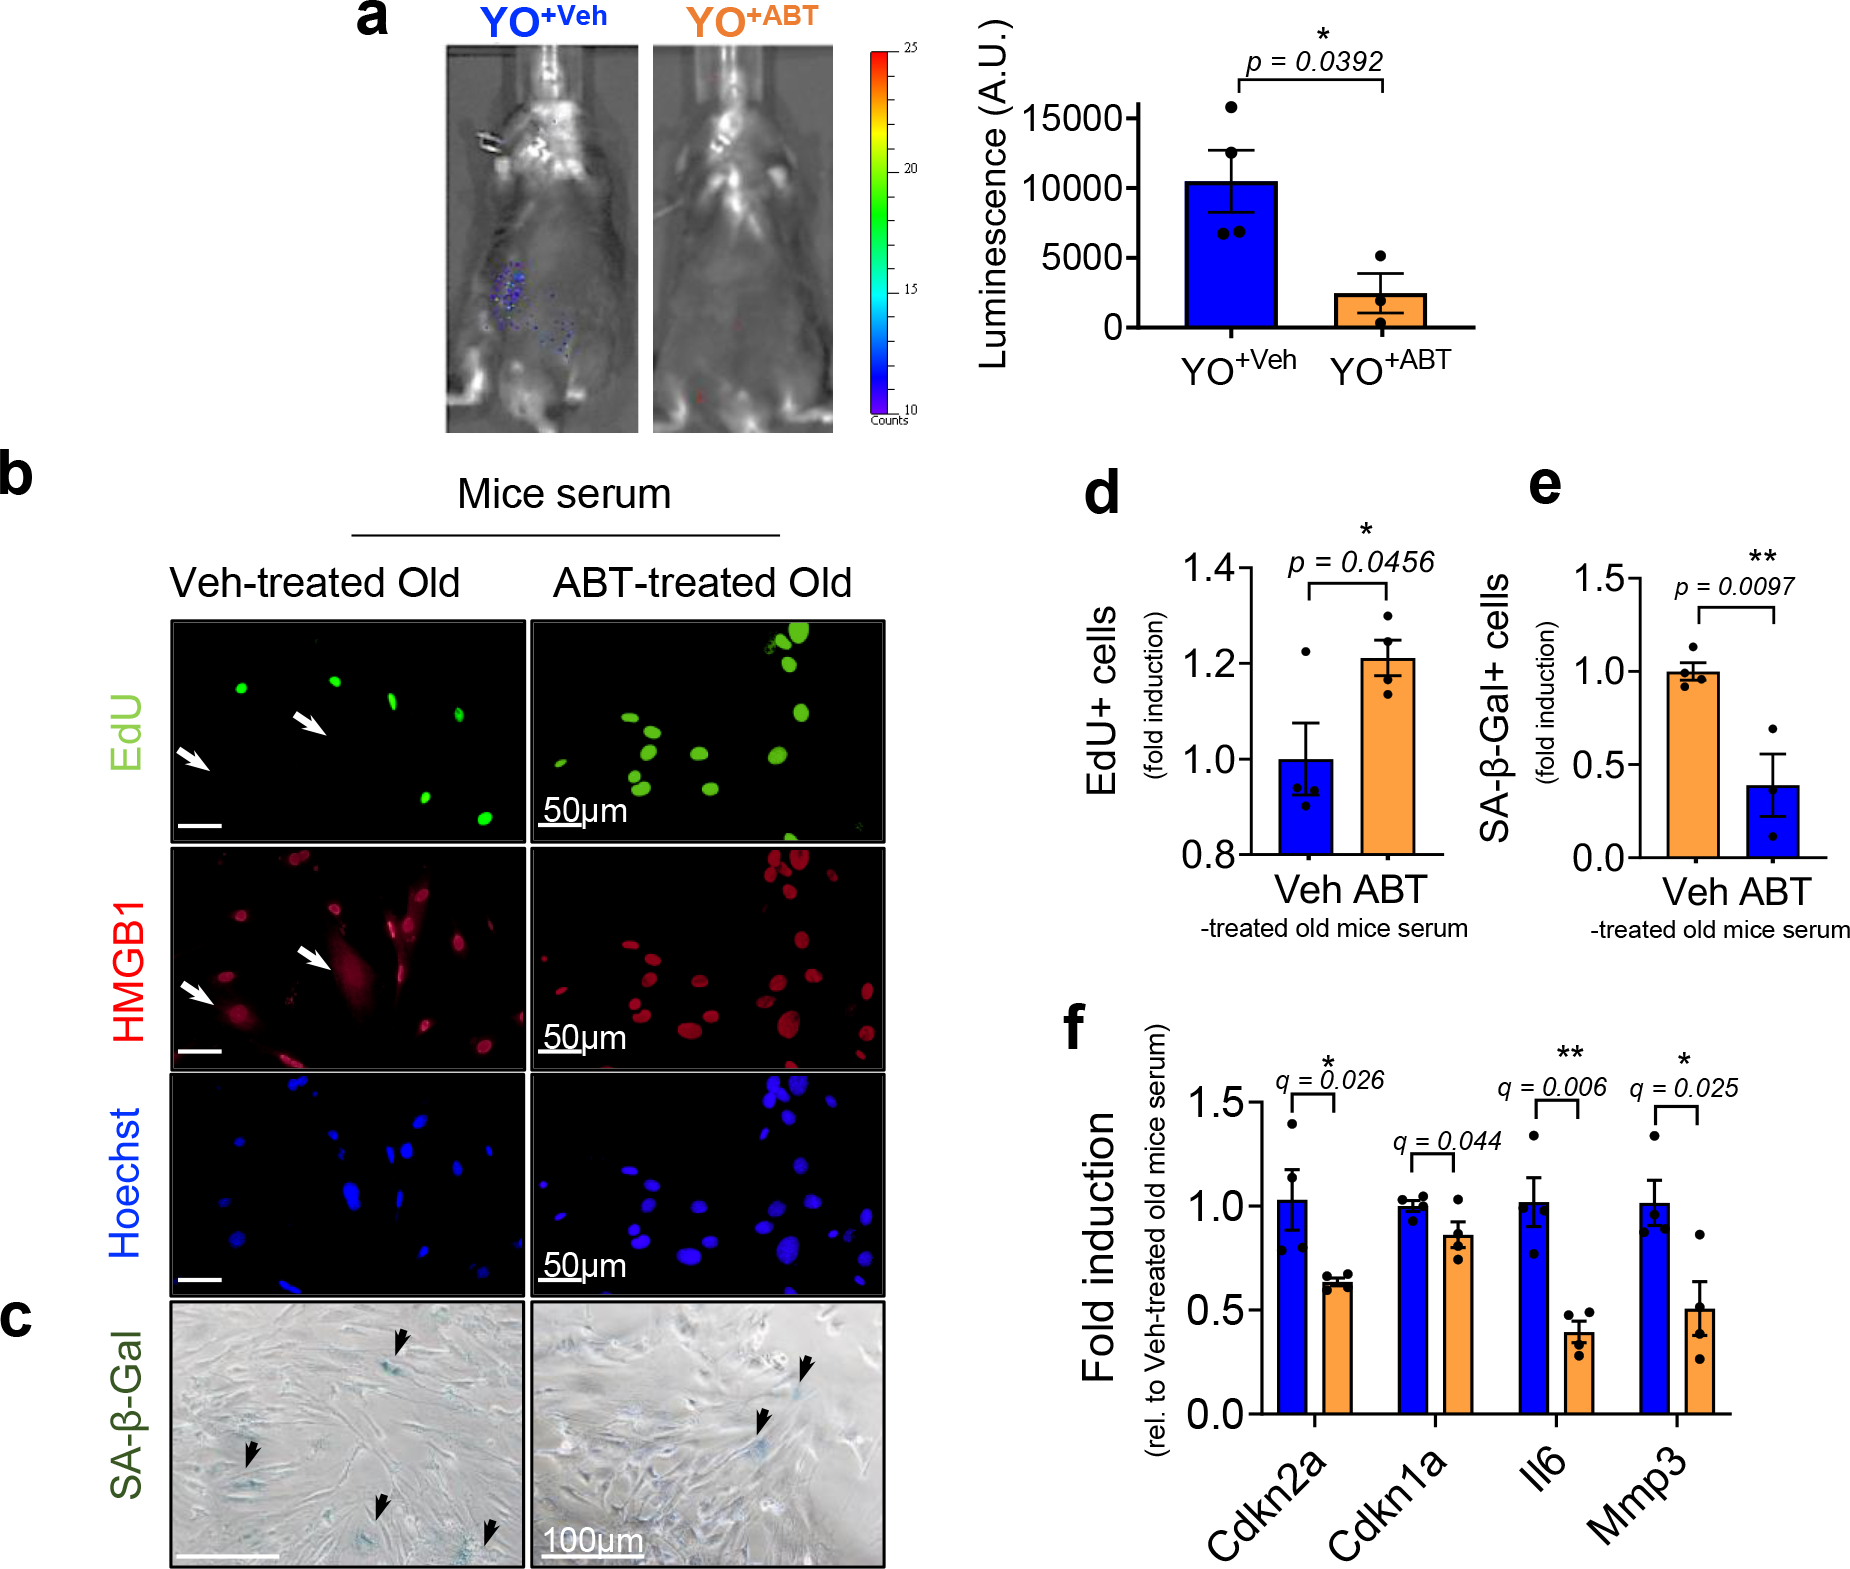
Extended Data Fig. 5 |. ABT263-treated old mouse serum abrogates senescence induction in non-senescent mouse cells (MDFs) in vivo and in culture.

(a) Representative luminescence images of young p16-3MR mice (3-month-old) receiving blood (22-month-old) from old C57BL/6J mice treated with vehicle (YO+Veh) or ABT263 (YO+ABT) 14 days after blood exchange (left) and quantification of the luminescence (right) (A.U.) (n = 4 mice for YO+Veh; n = 3 mice for YO+ABT). Each data point represents an individual mouse. (b) Representative EdU (green; EdU negative non-proliferating SnCs with arrows), HMGB1 (red; SnCs marked by nuclear loss with arrows), and Hoechst labeled nuclei (blue) visualized by immunostaining (n = 4 for each group / 5–8 images per n) and (c) SA-β-gal staining in MDFs cultured in Veh- or ABT-treated old mouse serum for 3 days (n = 4 for veh-treated old mice serum treated; n = 3 for ABT-treated old mouse serum; 3–6 images per n). Quantification of (d) EdU + and (e) SA-β-gal + MDFs. (f) mRNA levels for Cdkn2a and Cdkn1a and SASP factors Il6 and Mmp 3 days after culturing in Veh- or ABT-treated old mouse serum, determined by RT–PCR (n = 4 for each group). Data are means ± s.e.m. of biologically independent samples. Statistical significance was calculated using two-tailed Student’s t test (a, d-e) (exact P value was shown in the figures) and multiple t tests with a two-stage linear step-up procedure of Benjamini, Krieger and Yekutieli, with Q = 5%, *q < 0.05 (f). Scale bars are shown in each image. Rel, relative.
