. 2023 Feb 22;131(2):027005. doi: 10.1289/EHP11372

Figure 1.

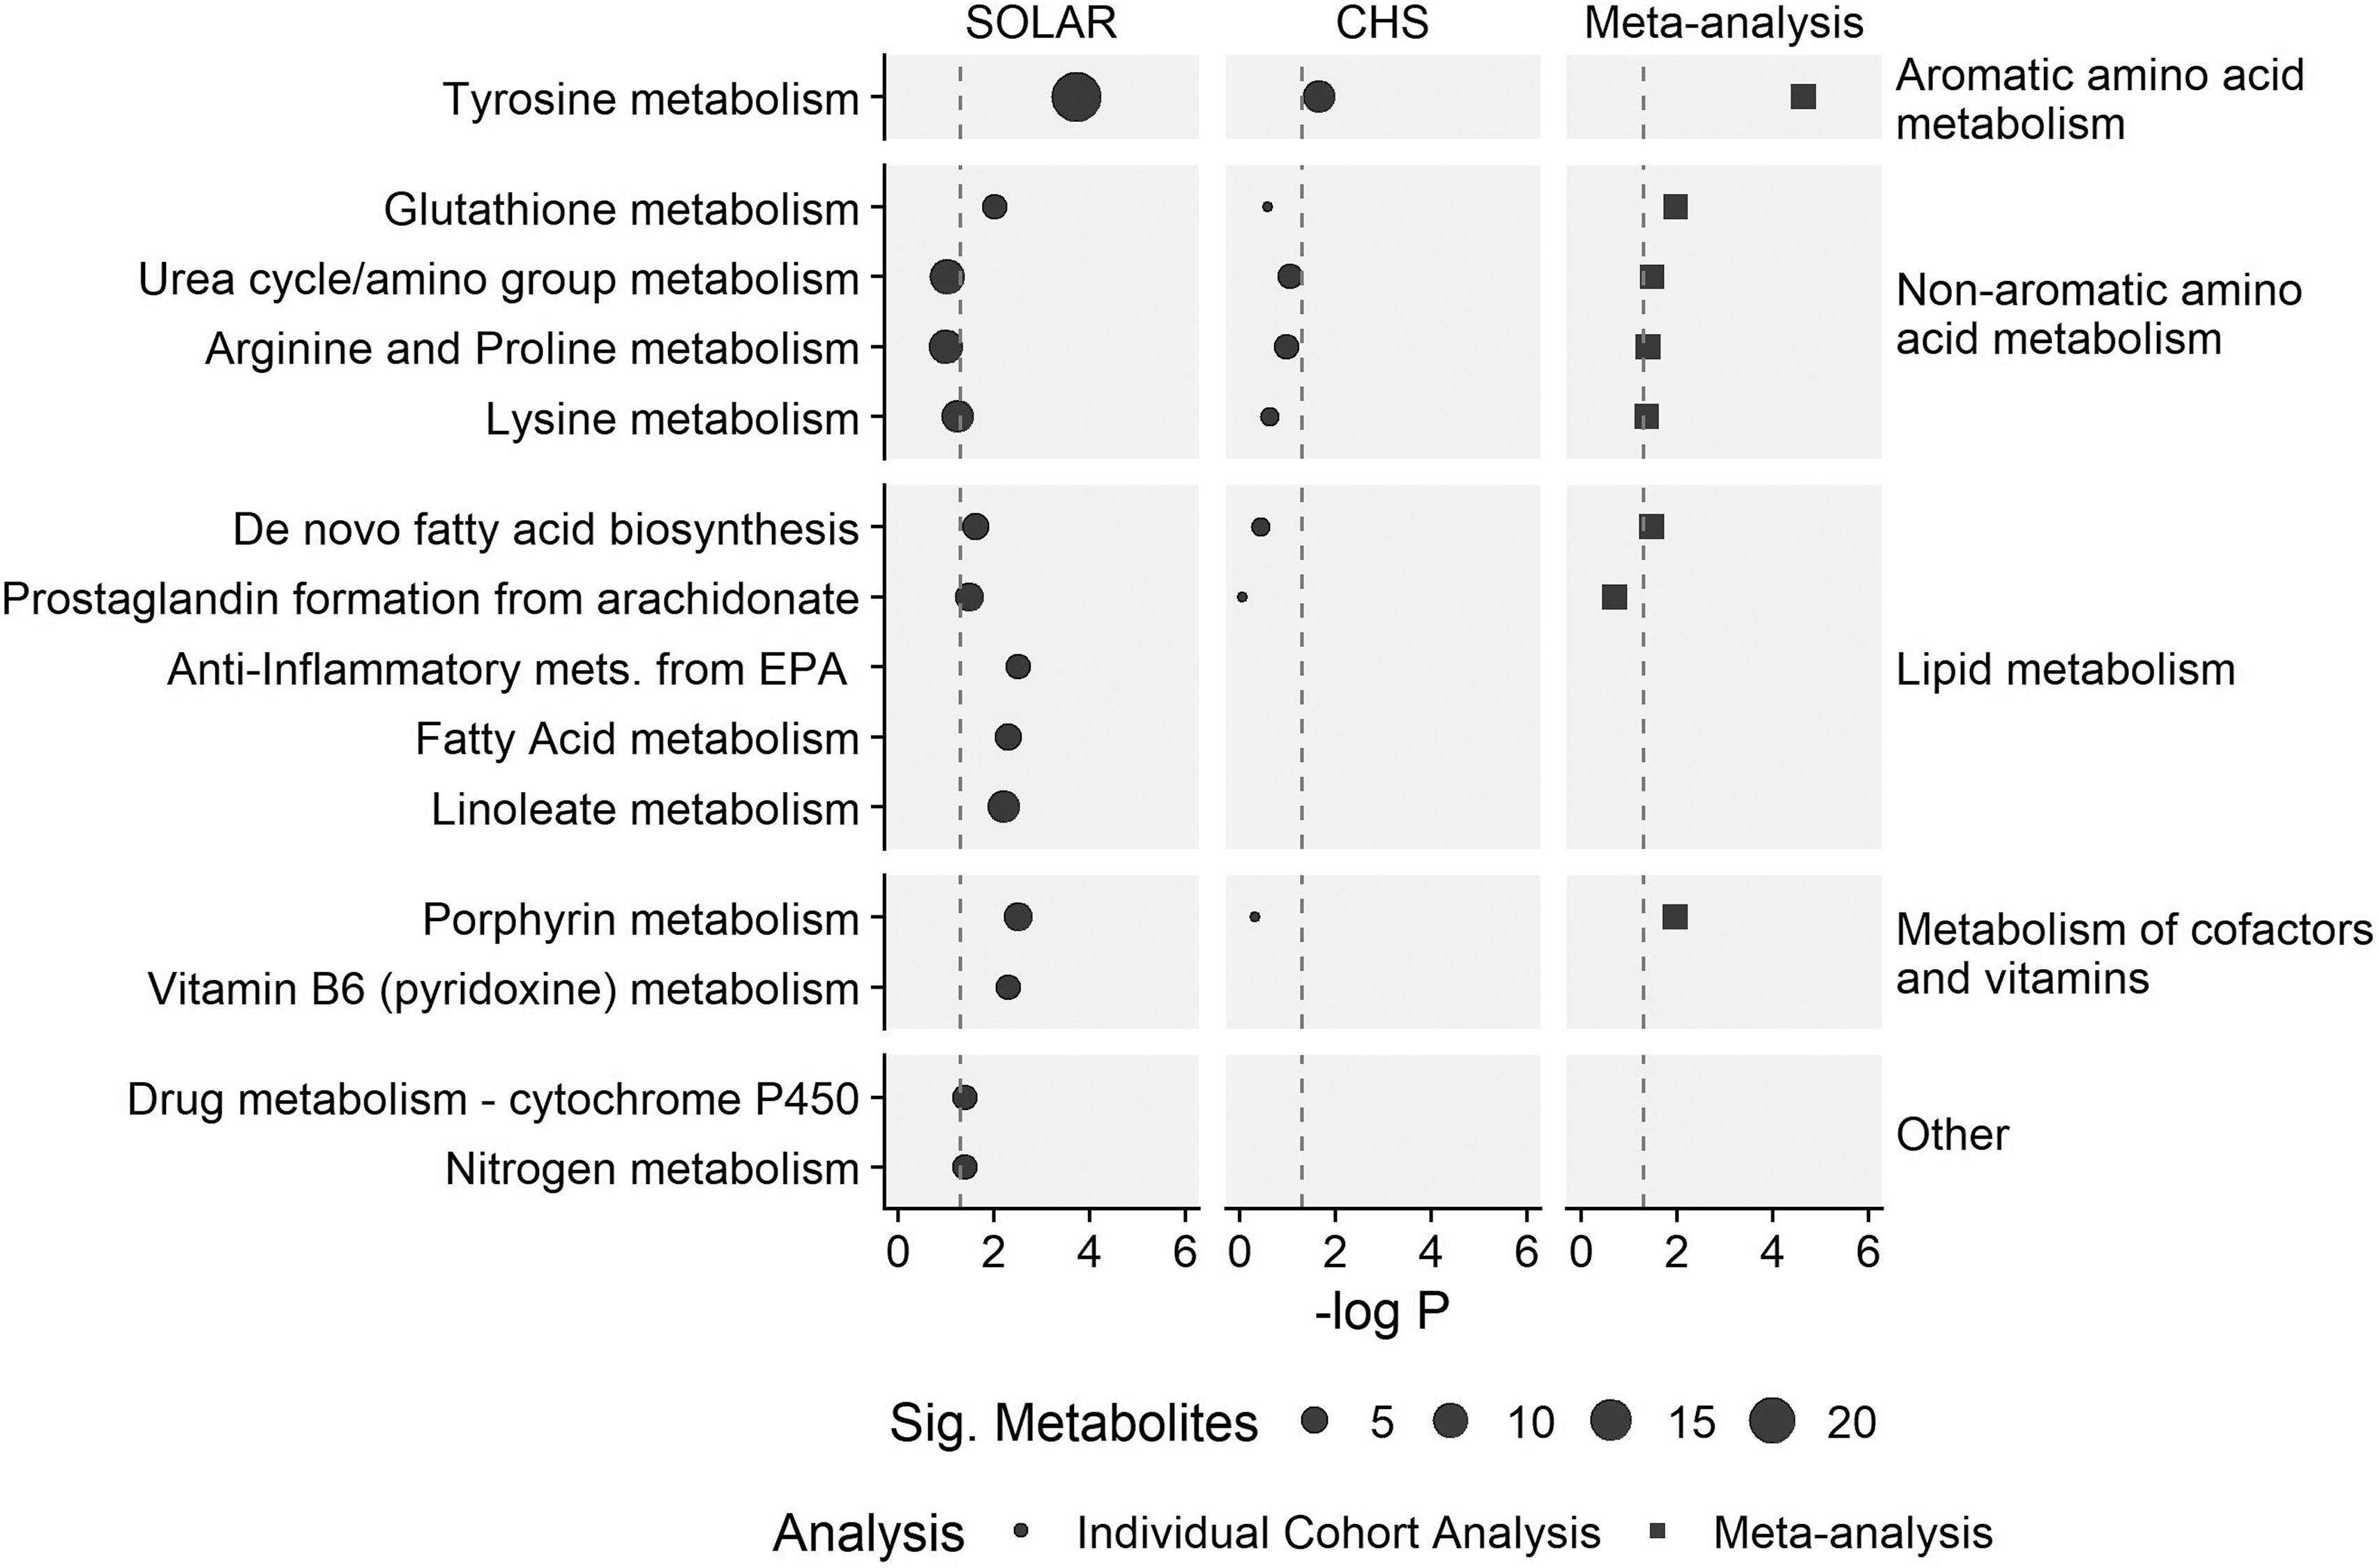
Figure is a dot graph with three columns titled Study of Latino Adolescents at Risk, Children’s Health Study, and Meta-analysis. There are five groups of pathways, named Other, which includes Nitrogen metabolism and Drug metabolism-cytochrome P 450; Metabolism of cofactors and vitamins, including Vitamin B6 (pyridoxine) metabolism and Porphyrin metabolism; Lipid metabolism, including Linoleate metabolism, Fatty acid metabolism, anti-inflammatory metabolism from Eicosapentaenoic acid, Prostaglandin formation from Arachidonate, and De novo fatty acid biosynthesis; Nonaromatic amino acid metabolism, including Lysine metabolism, Arginine and Proline metabolism, Urea cycle or amino group metabolism, and Glutathione metabolism; and Aromatic amino acid metabolism, including Tyrosine metabolism (y-axis) across negative log uppercase p, ranging from 0 to 6 in increments of 2 (x-axis) for analysis, individual cohort analysis, and meta-analysis, respectively.

Metabolic pathways associated with exposure to a mixture of six PFAS in adolescents from the SOLAR cohort (n=312) and young adults from the CHS cohort (n=137). Metabolic pathways are grouped into super pathways as indicated on the right of the plot. Meta-analysis p values are provided for pathways identified as being associated with PFAS in both cohorts. Dot size for the SOLAR and CHS cohorts are proportional to the number of significant metabolites associated with each pathway. Only pathways that were significant in either the SOLAR cohort, the CHS cohort, or the meta-analysis are presented here; for complete results see Table S3. Note: CHS, Children’s Health Study; EPA, eicosapentaenoic acid; PFAS, per- and polyfluoroalkyl substances; Sig, Significant; SOLAR, Study of Latino Adolescents at Risk.