Fig. 1.
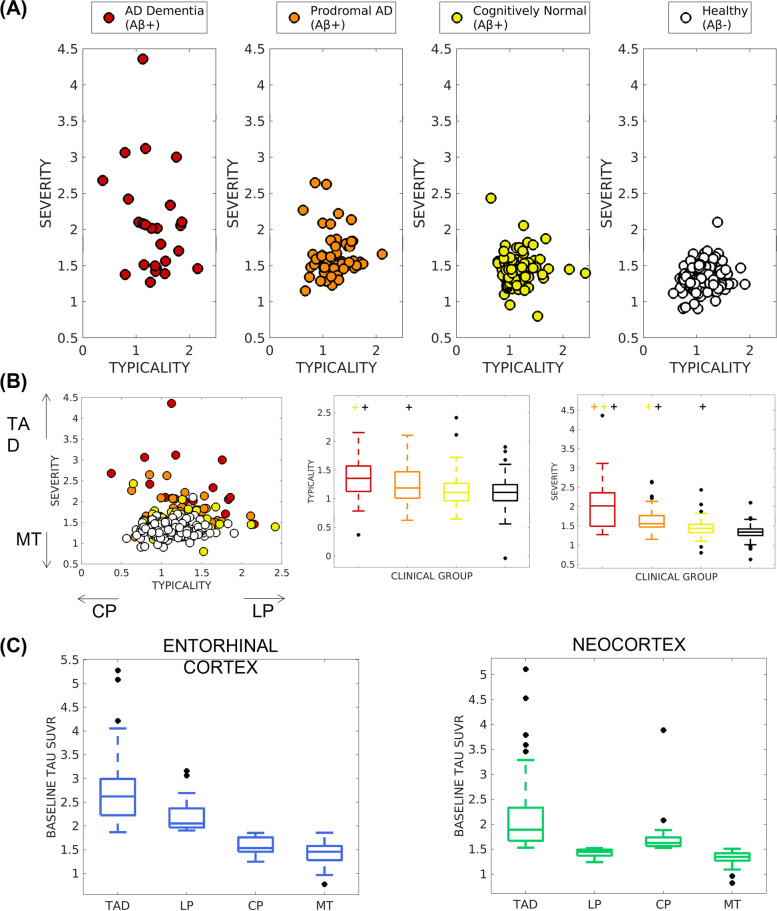
Baseline tau-PET patterns in the AD continuum characterized on a A, B continuous scale and C discrete scale. A Tau-PET patterns were assessed on a continuous scale across the AD continuum (including cognitively normal, prodromal AD, and AD dementia), shown separately in each clinical group for visual comparison. B Tau-PET patterns assessed on a continuous scale, shown relative to the other clinical groups (left) with the relative tendency of typicality (in terms of CP or LP) and severity (in terms of TAD or MT) shown for correspondence with C; variability of typicality (center) and severity (right) across the clinical groups is presented; significant difference (p < 0.05) for each group compared to the other groups is indicated by “+” above each boxplot. C Tau-PET patterns, assessed on a discrete scale in the AD continuum relative to the healthy group, identified four patterns whose tau-PET SUVR are shown in the entorhinal cortex (left) and the neocortex (right); by definition, there are significant differences (p < 0.05) between all pairs of patterns. AD = Alzheimer’s disease; TAD = typical AD pattern; LP = limbic predominant pattern; CP = cortical predominant pattern; MT = minimal tau

