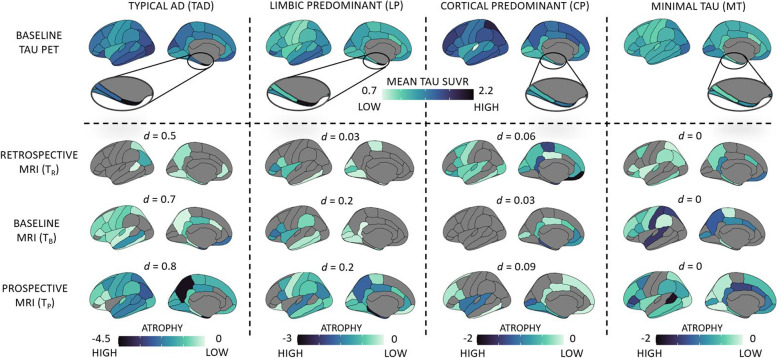
Fig. 4.
Baseline tau-PET patterns (discrete scale) and corresponding longitudinal atrophy in the AD continuum. Top panel: Topography of baseline tau-PET SUVR in four discrete tau-PET patterns in AD continuum (N = 173). The zoomed in view shows the tau-PET SUVR in the entorhinal cortex. Darker (dark blue) colors represent elevated tau-PET SUVR; bottom panels: topography of atrophy, measured in terms of longitudinal thickness (Z-score) corresponding to each tau-PET pattern, in a subcohort of AD continuum, tracked across retrospective, baseline and prospective timepoints (N = 61). Darker (dark blue) colors represent higher atrophy (thinner cortex). All cortical maps correspond to the left hemisphere (similar patterns were observed in the right hemisphere). Z-scores below 0 represent regional thinning. Sørensen–Dice coefficient comparing the topographical overlap between the tau-PET pattern at baseline and atrophy at each timepoint is reported as d. AD = Alzheimer’s disease; TR = retrospective timepoint; TB = baseline timepoint; TP = prospective timepoint; TAD = typical AD; LP = limbic predominant; CP = cortical predominant; MT = minimal tau; d = Sørensen–Dice coefficient

