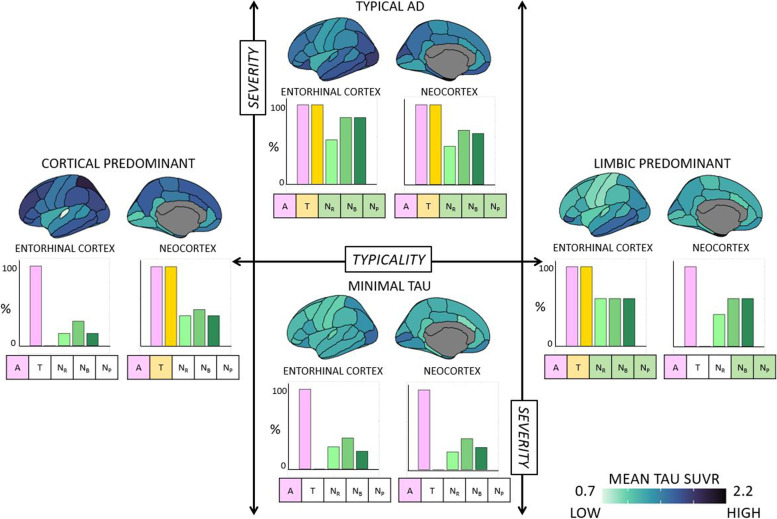
Fig. 5.
A/T/longitudinal-N classification corresponding to the tau-PET-based patterns in the AD continuum. A/T/longitudinal-N biomarker profiles for the four discrete tau-PET-based patterns were mapped in the subcohort of the AD continuum (N=61). Typicality (horizontal axis) and severity (vertical axis) dimensions are superposed, as proposed in the original conceptual framework [17]. A+ was determined by global Aβ-PET SUVR. T+ and longitudinal N+ were determined regionally in the entorhinal cortex and the neocortex, corresponding to the regions used to identify the tau-PET patterns [24]. For each tau-PET-based pattern, the proportion of A+, T+, and longitudinal N+ (along horizontal axis) are presented as percentages (along vertical axis) in the bar plots for the entorhinal cortex and the neocortex. Atrophy, used to represent N+, was adjusted for age at each timepoint relative to a group of healthy (Aβ−) individuals. The most prevalent A/T/longitudinal-N positive profile (≥50%) corresponding to a tau-PET-based pattern is shown in boxes under each bar plot with colored boxes. A/T/longitudinal-N = Aβ/Tau/longitudinal neurodegeneration; AD = Alzheimer’s disease; NR = atrophy at retrospective timepoint; NB = atrophy at baseline timepoint; NP = atrophy at prospective timepoint

