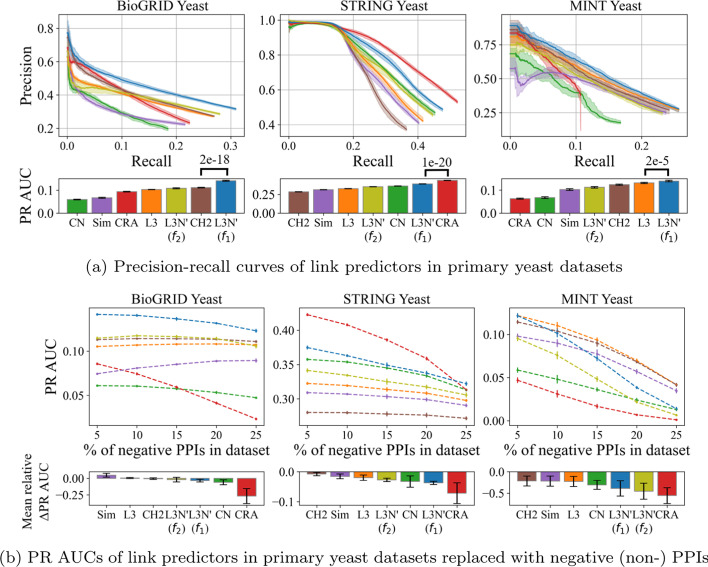
Fig. 6.
Precision-recall (PR) curves and its AUC-values (PR AUCs) of the link predictors computed with a 50% of the PPIs removed in the datasets. The solid lines show the median values and the shaded regions indicate the variance (the minimum and maximum values). The accompanying bar charts show the predictors’ PR AUC-values (the larger, the better). b Using these datasets, either 5%, 10%, 15%, 20%, or 25% of the PPIs are replaced with negative (non-) PPIs. For each these datasets, the PR AUCs computed by a link predictor are extracted at each data point and interpolated as a dotted line. The mean relative change of PR AUC w.r.t. the changes in the ratio of negative PPIs are obtained and denoted as “mean relative PR AUC” (the lower, the worse)

