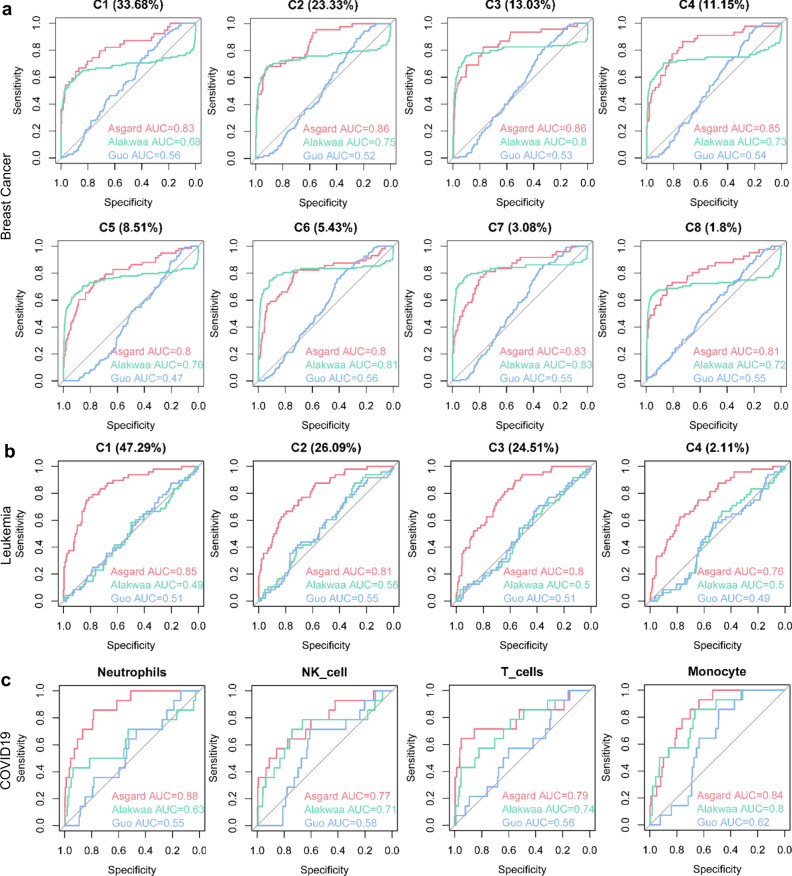
Fig. 3. Comparing ASGARD to other single-cell-based repurposing methods.
The receiver operating characteristic (ROC) curves and area under curve (AUC) scores of the ASGARD (red) and other published pipelines: Alakwaa’s pipeline (green) and Guo’s pipeline (blue). The results of drug/compound repurposing are shown on every cell cluster of the metastatic breast cancer dataset (a), every cell cluster of the acute lymphoblastic leukemia dataset (b) and 4 clusters with increased cell proportions in the decreased severe vs cured severe COVID-19 patients (c). The proportion of each single-cell cluster is shown in the brackets above each plot. Source data are provided as a Source Data file.

