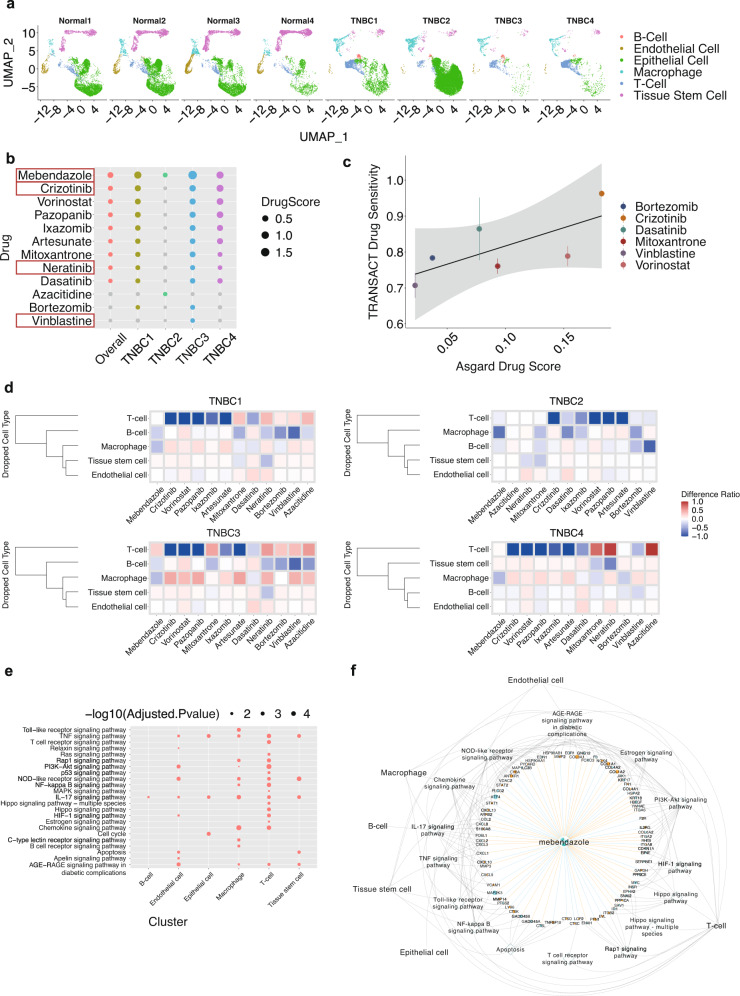
Fig. 4. Drug repurposing in triple-negative breast cancer (TNBC) patient samples.
a UMAP plots of single-cell data from four TNBC patient samples and four control samples from the same study. b The overall drug scores combining all TNBC samples as well as drug scores in each TNBC sample, among the top-ranked significant single drugs (FDR < 0.05). Gray color indicates a lack of significance for a particular drug in an individual. The four drugs in the red boxes overlapped with the top drugs predicted by ASGARD using PDX models of TNBC patients. c Comparison between TRANSACT drug sensitivity and ASGARD drug score. Data are presented as mean values ± /SD. n = 4 biologically independent samples. d Heatmap of the drug score changes in the cell-type-specific drop-one-out experiment, where each cell type in the tumor microenvironment is removed at a time. e Pathway enrichment analysis (TNBC vs. normal) for each cell cluster. P-values were determined by two-sided Fisher’s exact test and were adjusted by BH FDR. f The top drug candidate mebendazole, its target genes, pathways, and single-cell clusters. Orange node: up-regulated gene (logFC>1 and adjusted P-value < 0.05). Blue node: down-regulated gene (logFC < −1 and adjusted P-value < 0.05). Orange solid edge: drug stimulates gene expression. Blue solid edge: drug inhibits gene expression. The width of the edge is proportional to the strength of the drug effect. Gray dotted edge: gene belonging to a pathway. Gray backward slash: pathway significant in a cell cluster. P-values were determined by two-sided Fisher’s exact test and were adjusted by BH FDR. Source data are provided as a Source Data file.

