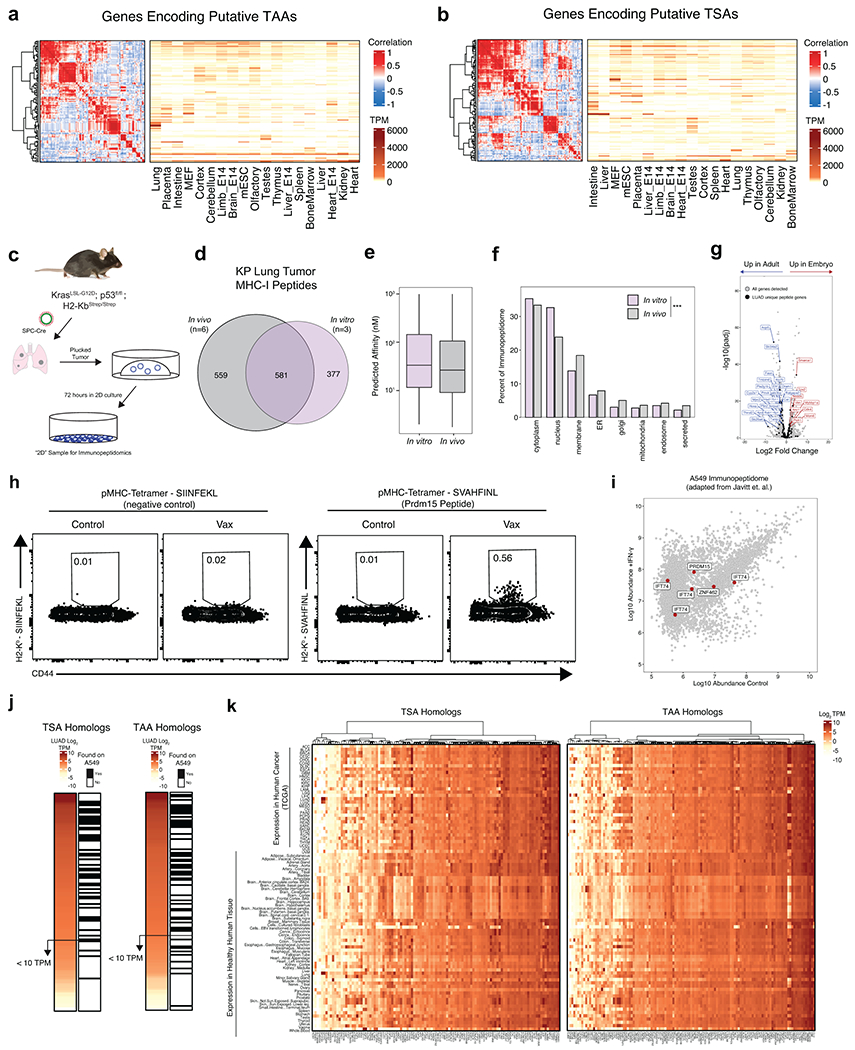
Extended Data Figure 9. (Related to Figure 4). Expression and presentation of putative tumor specific and tumor associated antigens.

a) Correlelogram and heatmap depicting transcript abundance (transcripts per million, TPM) of putative TSA genes across mouse tissues. b) Correlelogram and heatmap depicting TPM abundance of putative TAA genes across mouse tissues. c) Experimental schematic showing the derivation of samples for 2D immunopeptidomics. d) Venn diagram depicting the relationship between peptides identified by KP tumors in vivo and those identified in vitro. e) Boxplot showing the predicted affinity distributions of peptides isolated in vivo and in vitro. f) Distribution of source protein subcellular compartments for peptides identified in vivo (gray) and in vitro (green). P calculated with Fisher’s Exact test with Monte Carlo simulation. g) Volcano plot indicating differentially expressed genes between EPCAM+ cells from embryonic day 16.5 and post-natal day 28 mouse lung (Adapted from Lung Map Project). Data analyzed and P calculated with DEseq2. All genes detected are shown in grey and genes encoding for LUAD-unique peptides are indicated with black dots. h) Flow cytometry analysis of tumor-bearing lung tissue from naïve and vaccinated mice stained with control pMHC-I tetramer (SIINFEKL) or TAA tetramer (SVAHFINL). i) Peptides identified in A549 cells (Javitt et. al.) with and without treatment of IFN-γ/TNFα. Peptides derived from source proteins homologous to those using in the pooled vaccine are indicated in red. j) Heatmap depicting expression of the human homologs of putative TSAs and TAAs from this study and whether or not peptides derived from those genes were found to be presented on A549 cells from Javitt et. al. k) Heatmap depicting the RNA Expression of homologs of potential TSA and TAA genes as found in Figure 4a across all individual human tissues and 33 cancer types within TCGA.
