
Figure 3. Transcription and translation of LUAD-unique peptides.
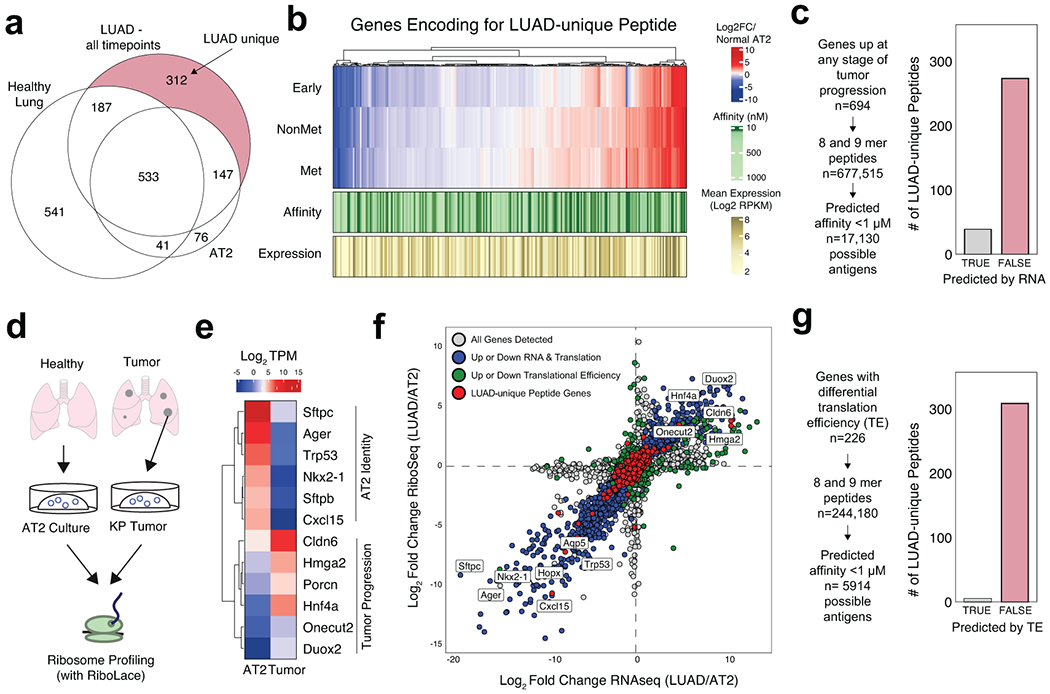
a) Venn diagram depicting the identification of LUAD-unique MHC-I Peptides. b) Heatmap showing the relative mRNA expression (red, white, blue), mean mRNA expression (gold), and predicted affinity (green) of genes encoding for LUAD-Unique peptides throughout tumor progression compared to normal AT2 cells (adapted from Chuang et. al.). c) Workflow depicting an in silico approach to predicting tumor-specific peptides based on RNA expression and predicted affinity. Histograms show the number of LUAD-unique peptides according to whether they were predicted (grey) or not predicted (red) by RNA/affinity analysis. d) Experiment outline for ribosome sequencing by RiboLace. e) Heatmap showing the relative translation intensity (TPM) for AT2 identity genes and genes associated with KP Tumor Progression. f) Comparison of RNAseq abundance (x-axis) and RiboSeq abundance (y-axis) in tumor organoids versus AT2 organoids. Genes coordinately up or down in both RNAseq & RiboSeq are shown in blue, genes exhibiting differential translational efficiency are shown in green, and genes encoding for LUAD-unique peptides are shown in red. g) Workflow depicting an approach to predict LUAD-unique peptides based on differential translation efficiency in LUAD versus AT2 (TE) and predicted affinity. Histograms show the number of LUAD-unique peptides according to whether they were predicted (grey) or not predicted (red) by differential TE.