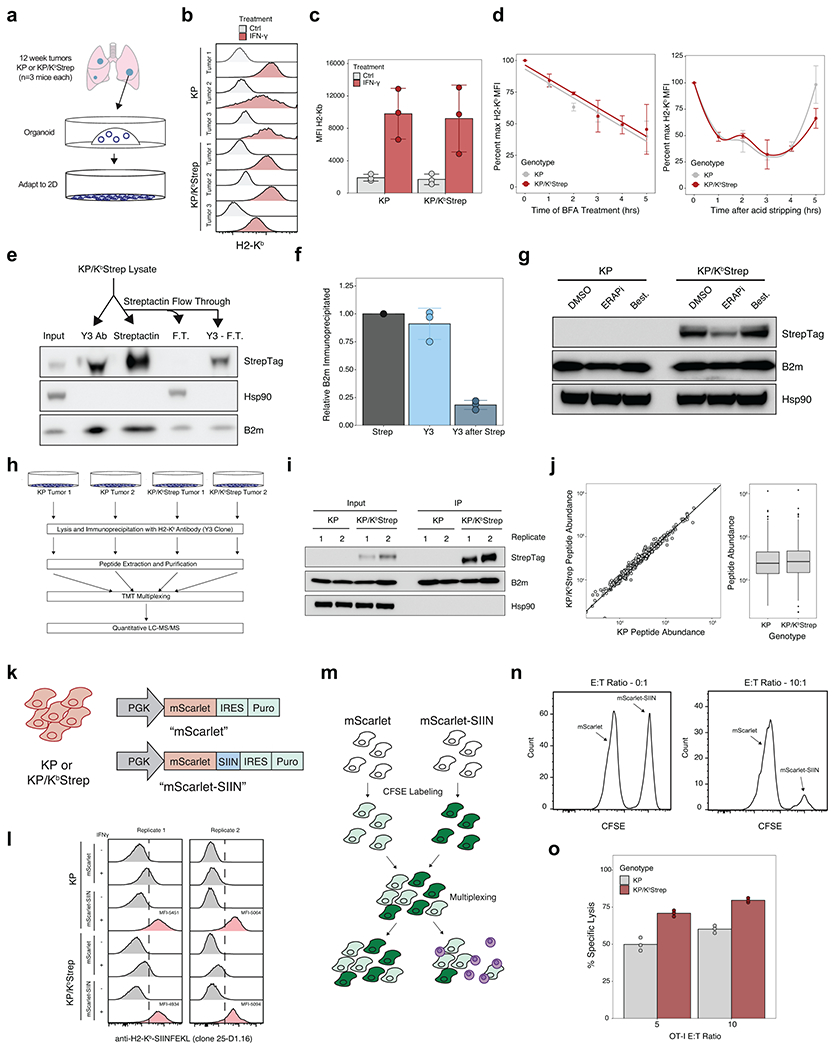
Extended Data Figure 4. (related to Figure 1). Biochemical comparison of WT and Strep tagged H2-Kb.

a) Isolation strategy for KP and KP/KbStrep cell lines. b) Histograms depicting fluorescence staining intensity of H2-Kb across KP and KP/KbStrep cell lines at baseline (gray) or following treatment with IFN-γ (red). c) Median fluorescence intensity quantification of H2-Kb staining across KP or KP/KbStrep cell lines at baseline (gray) or following treatment with IFN-γ (red). d) Relative H2-Kb staining intensity on KP (gray) or KP/KbStrep (red) cell lines following incubation with brefeldin A (BFA, left) or acute stripping with acid (300 mM glycine, pH 3.0, right) for the indicated times. e) Representative immunoblot depicting relative amounts of H2-Kb immunoprecipitation with antibody (Y3-Ab), Streptactin, or antibody following Streptactin (Y3-F.T.). f) Densitometric quantification of immunoprecipitated B2m intensity following antibody (Y3), streptactin, or antibody following streptactin (Y3 after Strep) purification schemes. g) Representative immunoblot depicting Strep-tagged H2-Kb expression in KP or KP/KbStrep cell lines following incubation with the aminopeptidase inhibitors ERAP1-in-1 or Bestatin. h) Experimental schematic for comparison of KP and KP/KbStrep immunopeptidomes from cultured cells using a quantitative, tandem mass tag (TMT) mass spectrometry strategy. i) Immunoblot depicting the abundance of immunoprecipitated MHC-I from samples described in h). j) Quantitative abundance comparison between all peptides identified in KP and KP/KbStrep samples. k) Illustration of the lentiviral constructs used for stable expression of SIINFEKL in KP and KP/KbStrep cell lines. l) Flow cytometric analysis of SIINKFEKL-H2-Kb complex surface expression using 25-D1.16 antibody. m) Experimental schematic used to evaluate specific T cell killing mediated by OT-I TCR transgenic T cells. n) Representative flow cytometry histograms depicting raw data used for calculating % specific lysis. o) Quantification of OT-I T cell killing in KP and KP/KbStrep cells.
