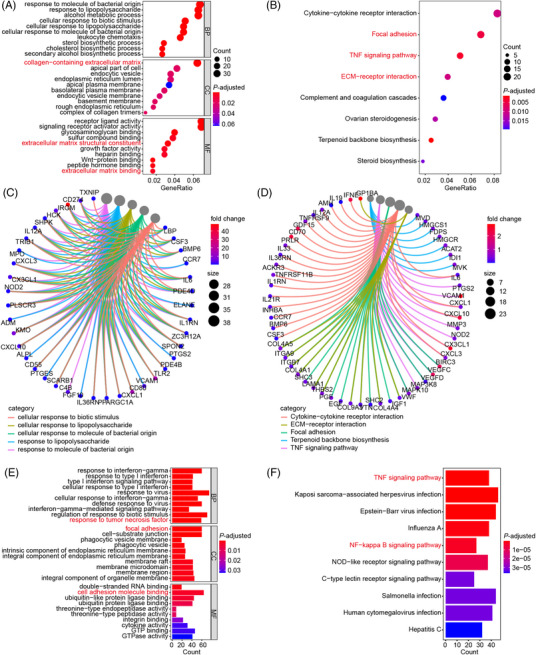
FIGURE 2.

OS potentially regulates TNF/NF‐κB signaling based on RNA‐seq analyses. (A–D) Bubble‐plots and chords displaying the top enriched Gene Ontology (GO) (A, C) and Kyoto Encyclopedia of Genes and Genomes (KEGG) (B, D) terms according to our RNA‐seq data. RA‐FLS were cultured with 20 μg/mL of OS for 48 h. OS‐treated RA‐FLS and the controls were collected and used for RNA‐seq. (E, F) Bar‐plots showing the top enriched GO (E) and KEGG (F) terms according to RNA‐seq data of TNF‐induced RA‐FLS and the controls in GSE129486.
