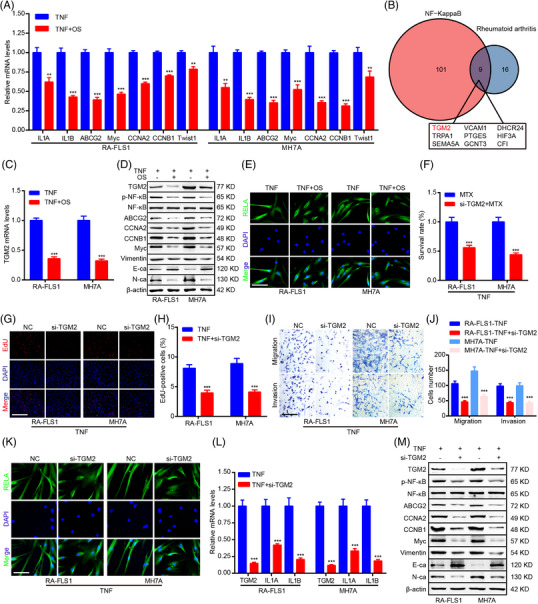
FIGURE 3.

OS suppresses transglutaminase 2 (TGM2) expression to attenuate the pathological phenotype of RA‐FLS through modulating NF‐κB signaling. (A) qPCR detection of ILA, ILB, ABCG2, Myc, CCNA2, CCNB1, and Twist1 mRNA levels in RA‐FLS. (B) A Venn diagram analysis identifying genes associated with NF‐κB and RA signaling based on GSE109449 dataset. (C) qPCR detection of TGM2 mRNA levels in RA‐FLS. (D) Western blot measurement of TGM2, p‐NF‐κB, NF‐κB, ABCG2, CCNA2, CCNB1, Myc, Vimentin, N‐ca, E‐ca, and β‐actin protein levels in RA‐FLS. (E) Immunofluorescence staining exhibiting the impact of OS on RELA subcellular localization. Scale bar: 12.5 μm. (F) CCK8 assays were adopted to show the impact of TGM2 knockdown on the cell viability of MTX‐treated RA‐FLS. (G, H) EdU assays were applied to detect the effect of TGM2 knockdown on DNA replication of RA‐FLS. Scale bar: 50 μm. (I, J) Transwell assays were adopted to determine the impact of TGM2 knockdown on RA‐FLS migration and invasion ability. Scale bar: 50 μm. (K) Immunofluorescence staining was performed to exhibit the impact of TGM2 knockdown on RELA subcellular localization. Scale bar: 12.5 μm. (L) qPCR detection of TGM2, IL1A, and IL1B mRNA levels in RA‐FLS. (M) Western blot measurement of TGM2, p‐NF‐κB, NF‐κB, ABCG2, CCNA2, CCNB1, Myc, vimentin, N‐ca, E‐ca, and β‐actin protein levels in RA‐FLS. ** p < 0.01 and *** p < 0.001 versus TNF‐treated group.
