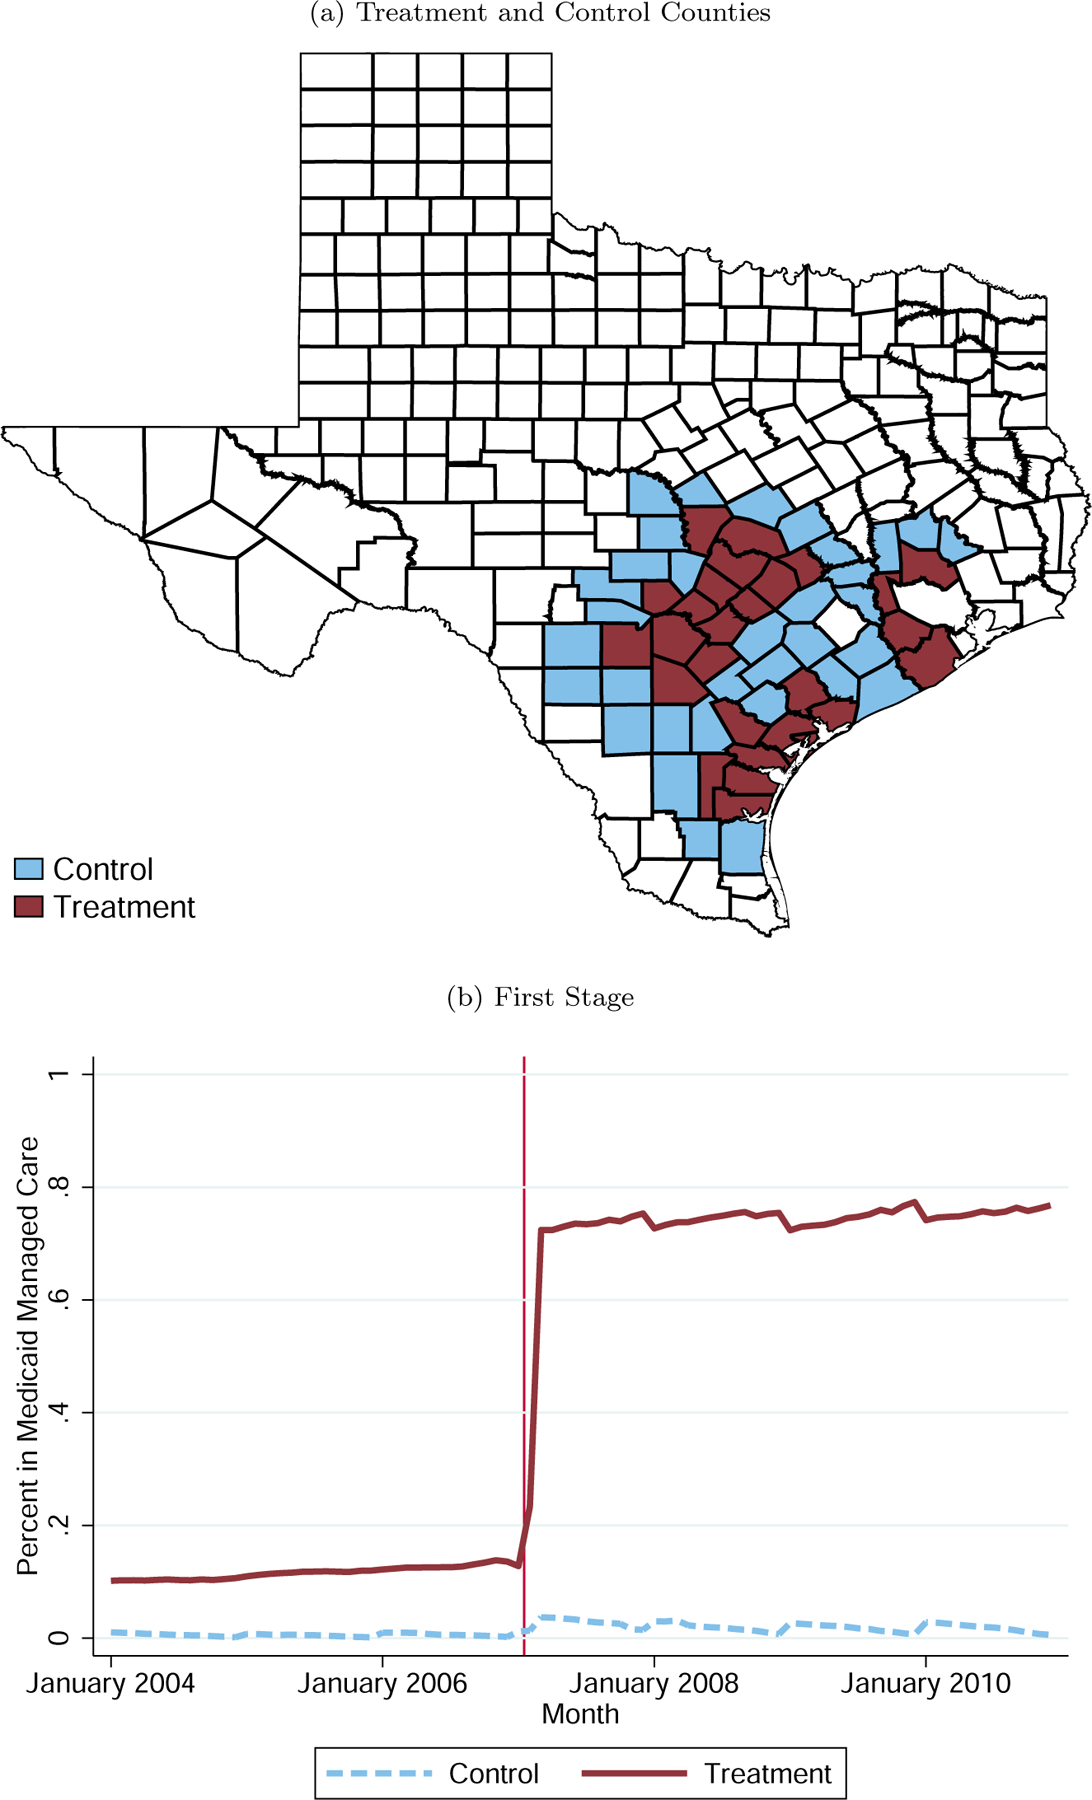
Figure 1. : Counties and First Stage.

Note: Figure shows the counties that we include in our sample as treatment and control counties and Medicaid managed care enrollment in the two groups of counties. In both panels, control counties are in light blue and treatment counties are in dark red. In Panel (b), the red vertical line between January and February 2007 corresponds to the date of the introduction of the STAR+Plus Medicaid managed care program in the treatment counties. For more details, see Section III.
