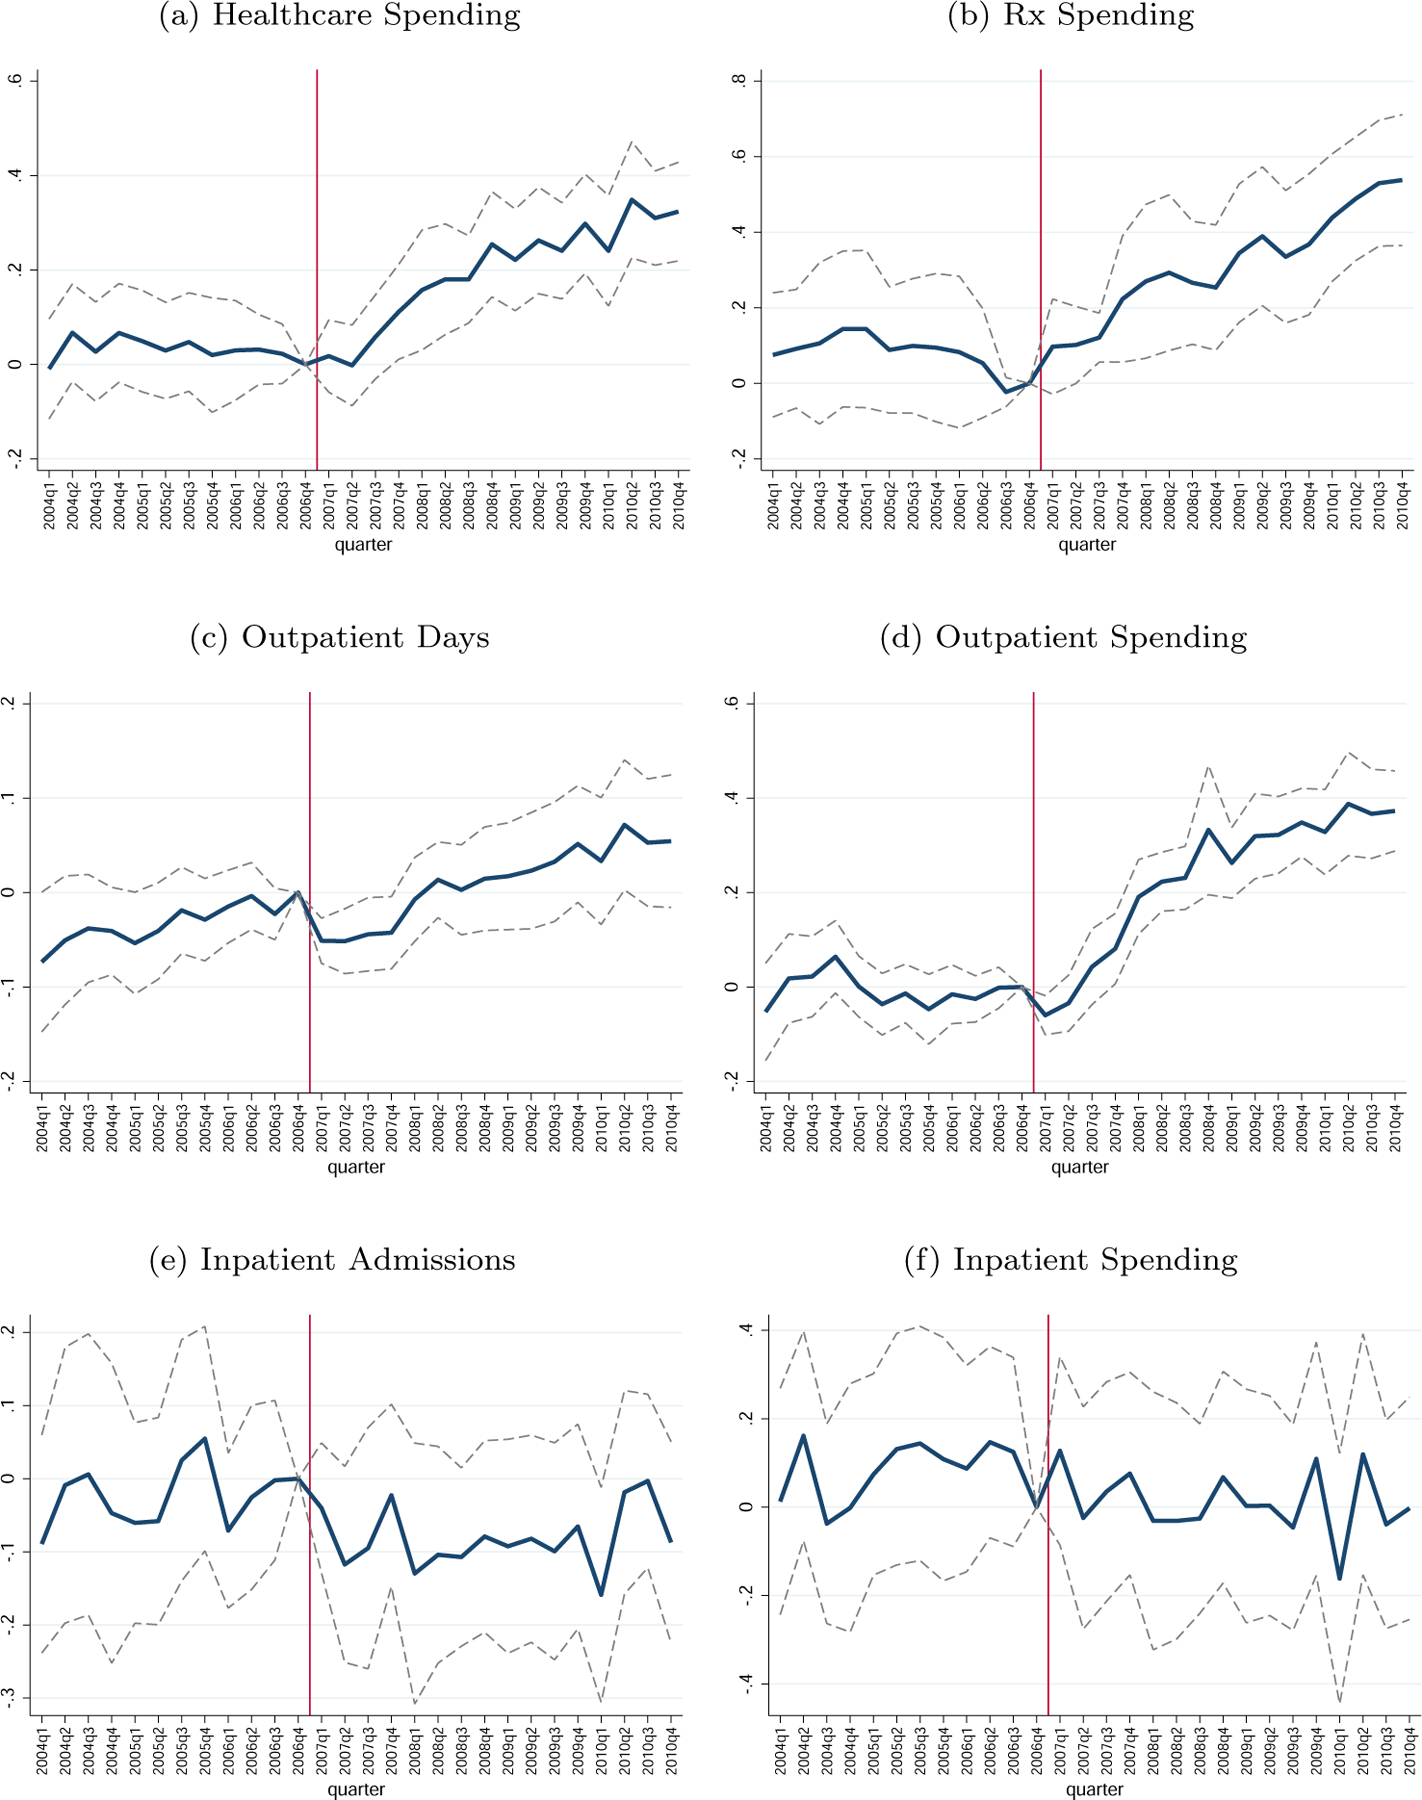
Figure 2. : Main Outcomes.

Note: Figure shows control-treatment differences in the main outcomes in percent terms relative to the treatment mean in the pre-period. These coefficients are from estimating the event study difference-in-differences specification in Equation (1), including individual fixed effects. For more details, see Section III. (N = 643; 751 beneficiary-quarters.)
