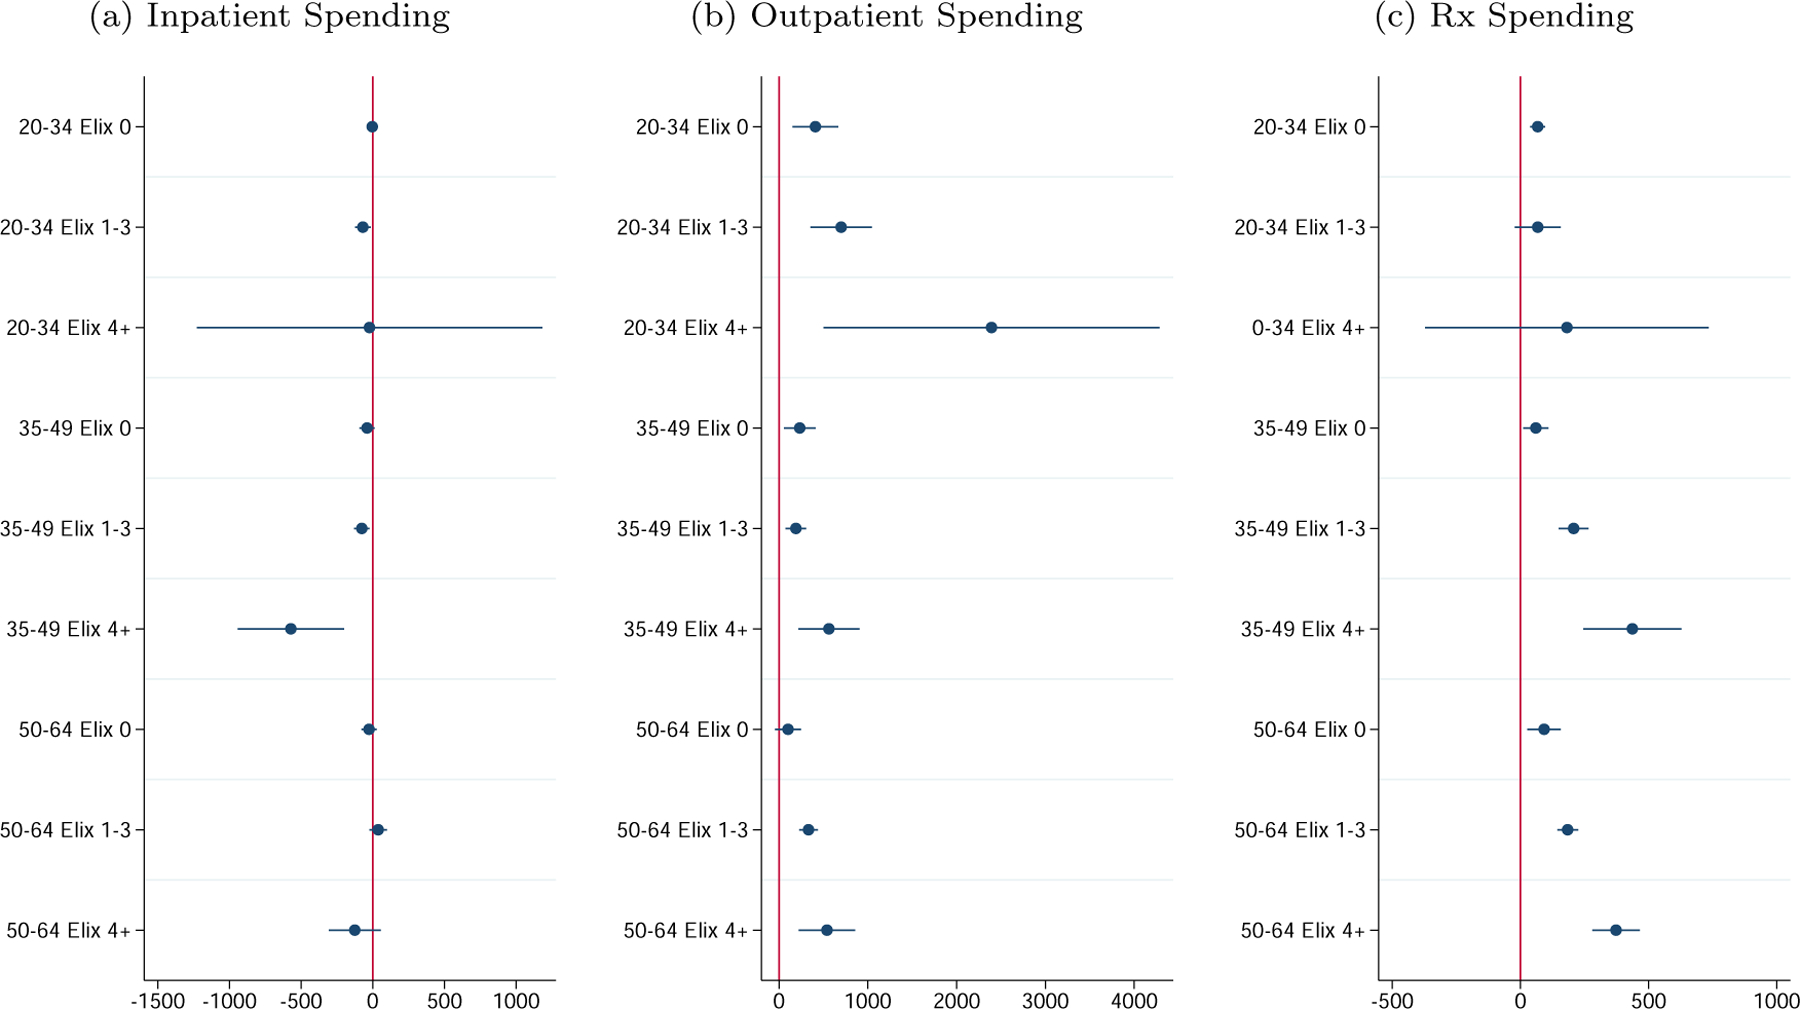
Figure 3. : Heterogeneity by Age and Health Status (Number of Comorbidities).

Note: Figure shows the impact of Medicaid managed care on inpatient spending, outpatient spending, and prescription drug spending by age and health status. Health status is measured as the average number of comorbidities during the pre-period, limiting our sample to beneficiaries for whom this measure can be generated. These coefficients are from estimating our instrumental variable specification separately for each age (20–34, 35–49, 50–64) by comorbidity group (no comorbidities, 1 to 3 comorbidities, at least 4 comorbidities). For more details, see Section III (N = 478, 938 beneficiary-quarters.)
