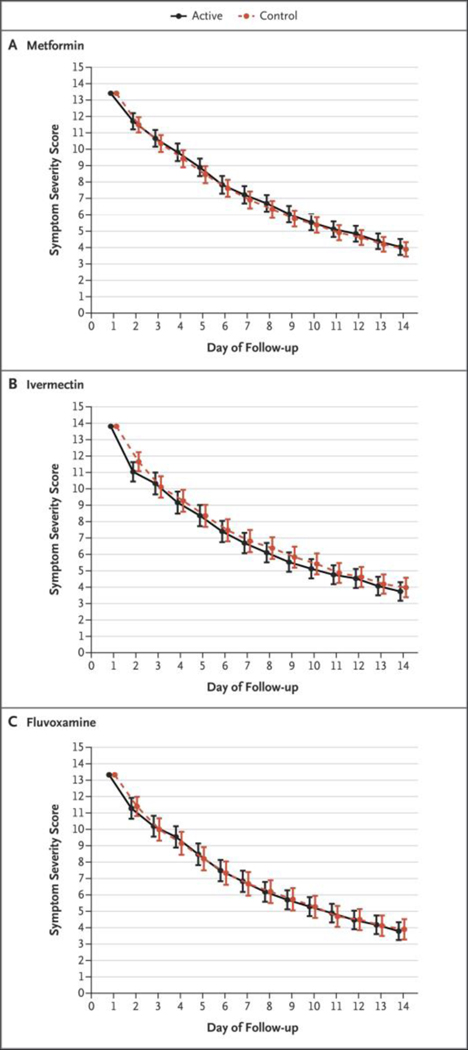
Figure 2. Total Scores on a Symptom Severity Scale during a 14-Day Period.
The three panels present the composite symptom scores in the active treatment groups and the control groups among the patients who received metformin, ivermectin, or fluvoxamine. Scores were calculated with the use of a generalized estimating equation after adjustment for the baseline score, vaccination status, and receipt of other medications during the trial. Shown on the y axis is the composite score of 14 symptoms, which were graded as none (0), mild (1), moderate (2), or severe (3). Overall, 80% of the patients contributed data on the symptom logs; the frequency of missing data was approximately 25% on each of the 14 days. Additional details regarding specific symptoms are provided in Figures S4 and S5 in the Supplementary Appendix.

