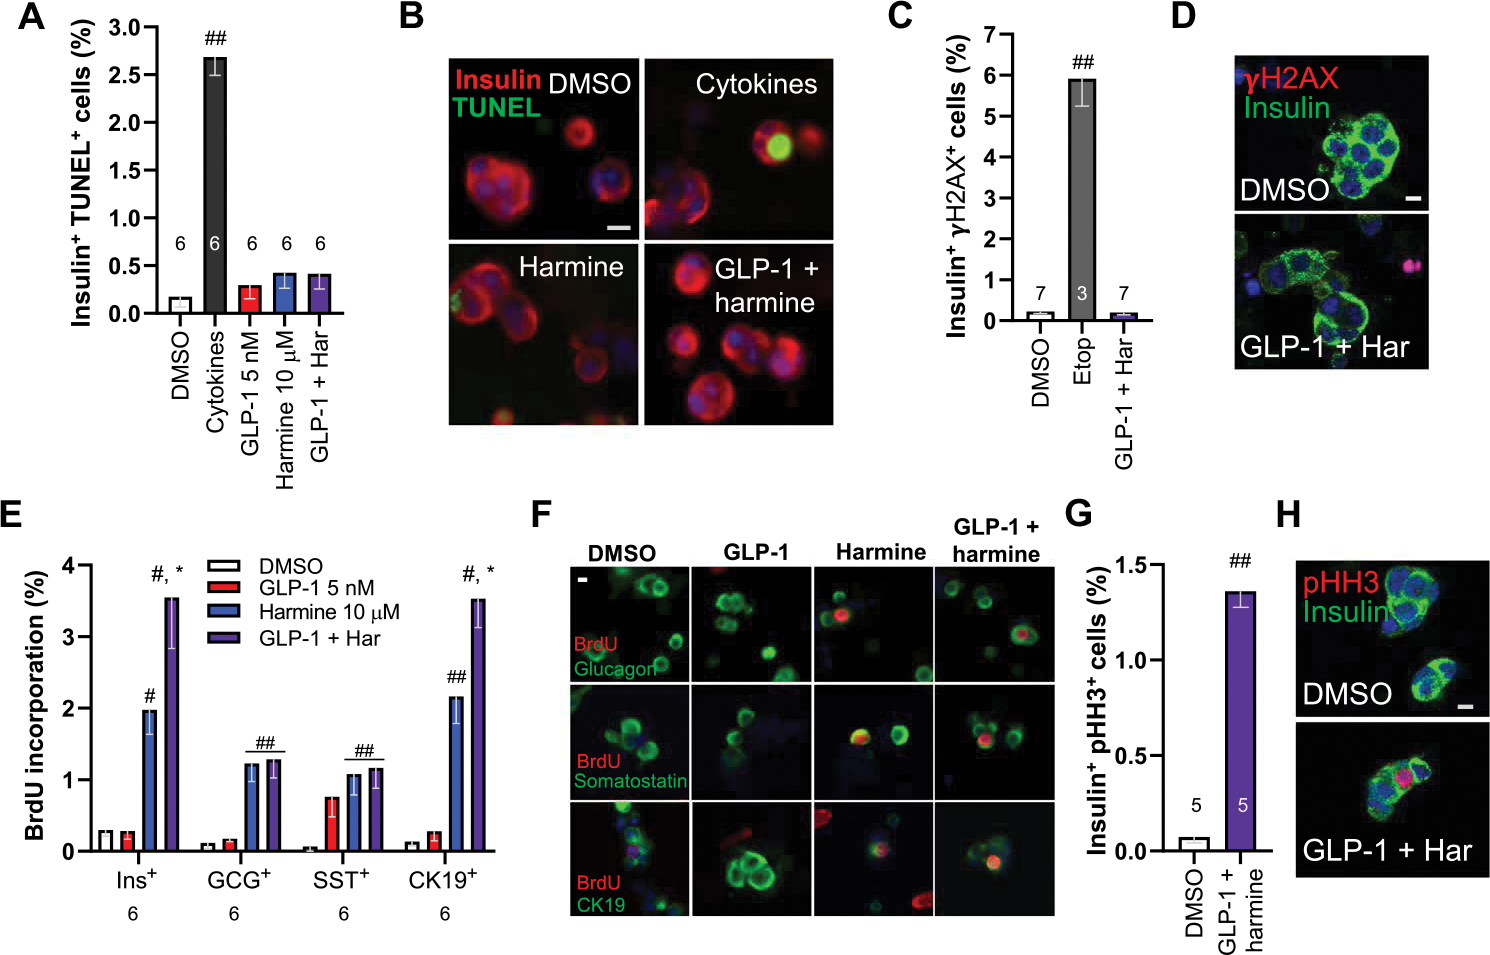
Fig. 3. The effects of harmine–GLP-1 on proliferation in non–β cells, β cell death, and DNA damage.

(A) The effects of harmine–GLP-1 on cell death as assessed by TUNEL assay. The cytokine cocktail in the second bar is a positive control containing TNFα and IL-1β. The numbers of islet donors are indicated within the bars. Examples of TUNEL responses under the conditions shown in (B). A minimum of 3000 β cells were counted for each bar. (C) DNA damage as assessed by γH2AX immunocytochemistry in response to harmine (10 μM) and GLP-1 (5 nM) or positive control etoposide (Etop) (20 μM). A minimum of 3000 β cells were counted for each bar. (D) An example of γH2AX immunocytochemistry. (E) Proliferation as assessed using BrdU labeling in β (INS+ ), α (GCG+ ), δ (SST+ ), and ductal (CK19+ ) cells in response to the treatments shown in the inset. Numbers of cells counted for each bar ranged from 2820 to 4060 for β cells, 2935 to 3575 for α cells, 1050 to 1220 for δ cells, and 2040 to 2315 for CK19+ cells. (F) Examples of BrdU immunolabeling in human islet cell subtypes in response to the agents shown. (G) Immunolabeling of dispersed human β cells for pHH3 and insulin. (H) An example of pHH3-insulin colabeling in dispersed human β cells. All bars indicate means ± SEM. Numbers above or below the bars indicate the sample size of human islet donors. #P < 0.01 and ##P < 0.001 versus control by two-tailed paired t test. *P < 0.01 versus harmine alone by paired t test. Scale bars, 10 μm (B, D, F, and H)
