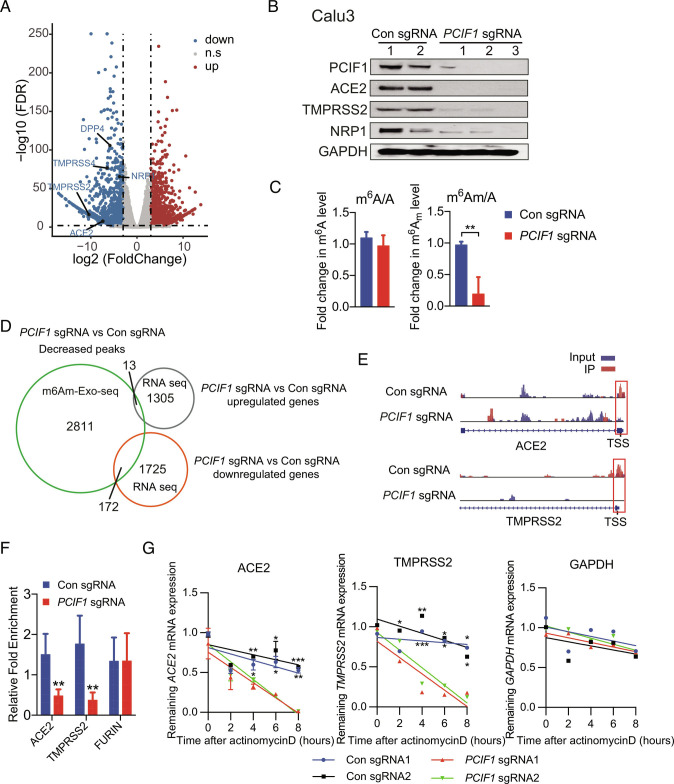
Fig. 2.
Identification of PCIF1 target genes by RNA-seq and m6Am-exo-seq. A, Volcano plot of DEGs in PCIF1-KO Calu-3 cells compared with control cells. Significantly (q < 0.01, log2 fold change < −3 or > 3) down-regulated or up-regulated genes are shown in blue and red, respectively. B, Western blot analysis of the indicated proteins in PCIF1-KO and control Calu-3 cells. GAPDH served as a loading control. C, HPLC-MS/MS-based quantification of m6Am and m6A levels relative to unmodified adenosine (A) in mRNA from PCIF1-KO and control Calu-3 cells. Data are expressed as the mean ± SD (n = 3). **P < 0.01 by Student’s t test. D, Venn diagram showing overlap between genes identified by m6Am-exo-seq and RNA-seq as indicated. E, Genome browser views of m6Am sites in ACE2 and TMPRSS2 mRNAs from control and PCIF1-KO Calu-3 cells. Data are representative of duplicate samples. Scale for top tracks: 1 to 10/coverage. Scale for bottom tracks: 0 to 20/coverage. Read coverage of input sample and Immunoprecipitation (IP) sample are shown in blue and red, respectively. Red rectangles outline the m6Am peaks located near the TSS. F, m6Am-exo-qPCR analysis of m6Am enrichment in ACE2 and TMPRSS2 mRNAs from control and PCIF1-KO Calu-3 cells. FURIN served as a negative control. Data are presented as the mean ± SD (n = 3). **P < 0.01 by Student’s t test. G, qRT-PCR quantification of ACE2, TMPRSS2, and GAPDH mRNA in PCIF1-KO and control Calu-3 cells treated with actinomycin D for the indicated times. Data are presented as the mean ± SD (n = 3). *P < 0.05, **P < 0.01, ***P < 0.001 by Student’s t test.

