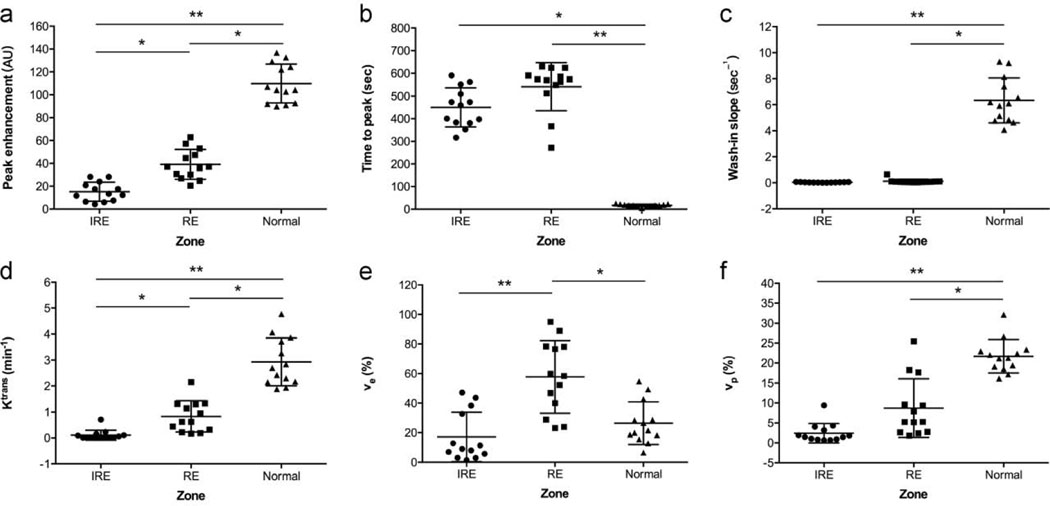
Figure 3:
Scatter dot plots show peak enhancement (a), time to peak (b), wash-in slope (c), Ktrans (d), ve (e) and vp (f) for the IRE zones (n = 13), RE zones (n = 13) and the normal liver parenchyma (n = 13). Peak enhancement, Ktrans and ve had the ability to differentiate RE from IRE zones. Statistically significant differences are marked by stars (* P < 0.05, ** P < 0.0001). The larger horizontal bar indicates the mean value, error bars indicate standard deviations, and dots indicate individual values.

