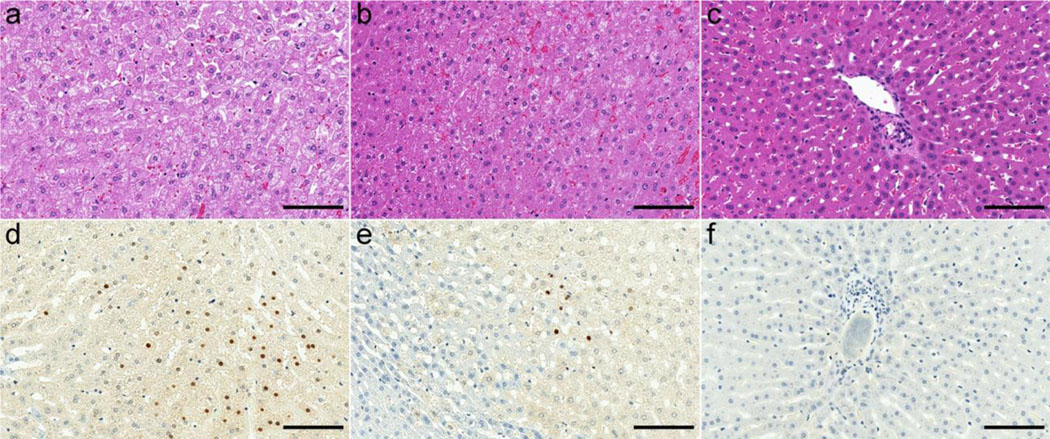
Figure 4:

Representative histologic images of the IRE zone (a, d), the RE zone (b, e) and the normal liver parenchyma (c, f). In the IRE zone, there is obvious hepatocyte necrosis and hemorrhage on the HE-stained image (a), and apoptotic cells (brown stain) were about 22.7% of the total cells on the TUNEL-stained image (d). In the RE zone, there is hepatocyte swelling with vacuoles, occasional hepatocyte necrosis and congestion on the HE-stained image (b), and apoptotic cells (brown stain) were about 3% of the total cells on the TUNEL-stained image (e). In the normal liver parenchyma, there is no obvious abnormal feature on the HE-stained image (c), and no apoptosis is visible on the TUNEL-stained image (f). Scale bar, 100 μm for all the images.
