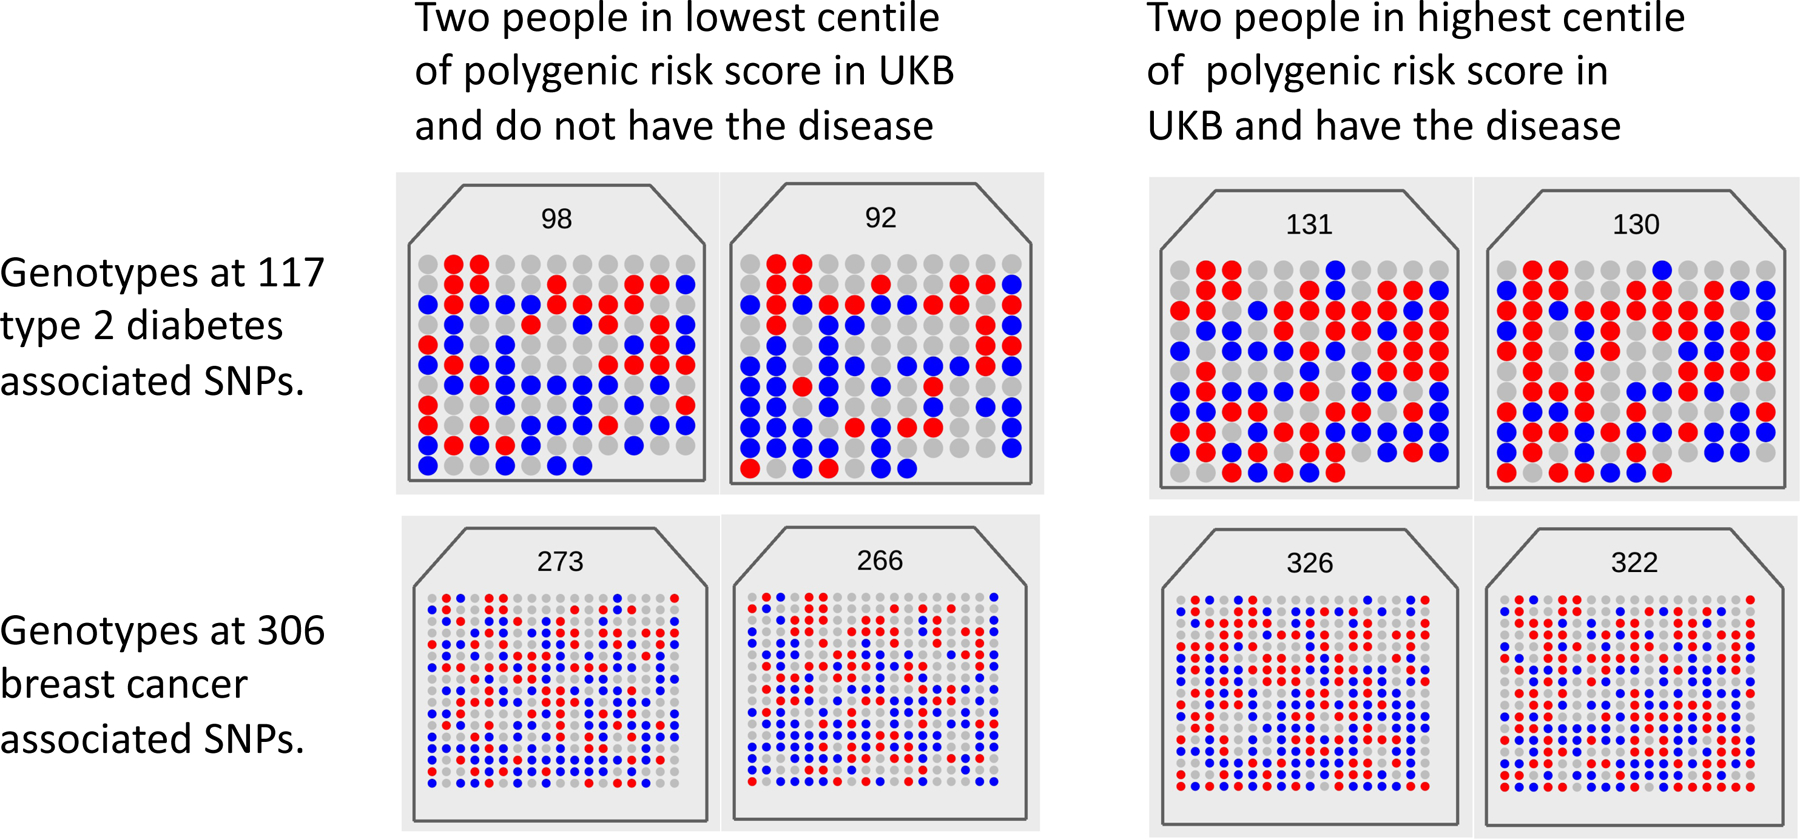
Fig. 1. Visualizing the polygenicity of common disease.

Each panel shows the number of risk alleles (0 = gray, 1 = blue, 2 = red) for an individual from the UK Biobank (UKB) at each of 117 type 2 diabetes (T2D) and 306 breast cancer (BC) disease-associated loci. The total counts of risk alleles for the individual is listed at the top of each panel. For each disease, two individuals were selected with disease and in the top 1% of the count of the number of risk alleles, and two controls without disease from the bottom 1%. The panels show that (i) every individual has a unique risk profile, (ii) controls carry risk alleles at many loci and (iii) cases have on average only a small increase in the risk variant burden. Selecting the top and bottom 1% of this population on the number of risk variants gives mean numbers of risk variants of 131 and 98 for T2D and 325 and 269 for BC, respectively, with disease prevalence of 7% versus 2% (T2D) and 19% versus 2% (BC). Hence, although the mean number of risk variants between cases and controls is generally small, individuals who have a high burden of risk variants have greatly increased risk of disease. Polygenic scores are not diagnostic; most individuals in the top 1% of the PRS distribution do not have disease and, conversely, some in the bottom 1% do.
