Fig. 1.
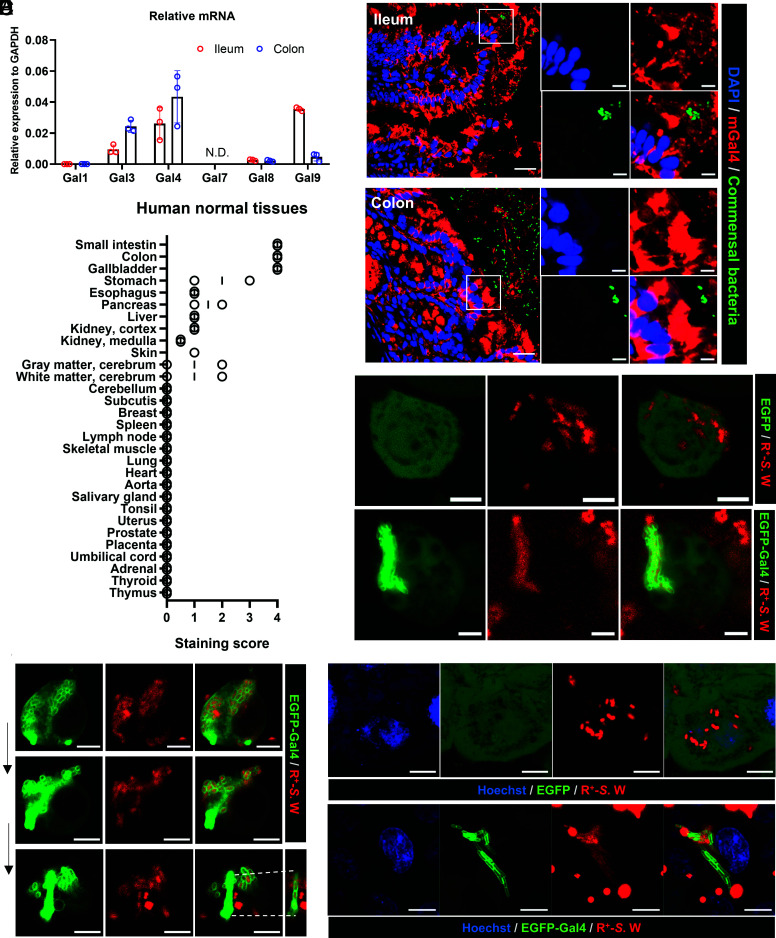
Intracellular galectin-4 in IECs coats cytosolic bacteria and induces their chaining and aggregation. (A) The levels of galectin (Gal) mRNA relative to that of glyceraldehyde-3-phosphate dehydrogenase (GAPDH) in mouse ileum and colon tissues, as determined by real-time PCR. Data represent the mean ± SD, N = 3. N.D., not detected. (B) Immunofluorescence and fluorescence in situ hybridization staining of ileum and colon sections from a wild-type mouse. DAPI (blue), commensal bacteria detected by the universal bacterial probe (green), and anti-mouse galectin-4 (mGal4, red) staining. (Scale bars, 20 µm or 5 µm in zoomed images.) The images of isotype control staining conducted in the same experiment are shown in the SI Appendix, Fig. S2. (C) The scores of immunohistochemistry staining of galectin-4 in human normal tissues. (D) HT-29-EGFP and HT-29-EGFP-Gal4 cells both generated from HT-29 cells with endogenous galectin-4 deleted were treated with wortmannin and infected with RFP-expressing S. enterica serovar Worthington (R+-S.W). Representative Images obtained 10 h after infection are shown. Bacteria in HT-29-EGFP cells (Upper) appear as scattered red spots, while those in HT-29-EGFP-Gal4 cells (Lower) appear as compact green elongated aggregates (coated with EGFP-galectin-4). (Scale bars, 5 µm.) (E) Images of the same infected HT-29 cell were taken every 10 min by confocal microscopy after 12 h of infection. (Scale bars, 5 µm.) (F) HeLa-EGFP and HeLa-EGFP-Gal4 cells were infected with R+-S.W. Representative Images obtained 6 h after infection are shown. Bacteria in HeLa-EGFP cells (Upper) appear as scattered red spots, while those in HeLa-EGFP-Gal4 cells (Lower) appear as compact green elongated aggregates (coated with EGFP-galectin-4). Hoechst (blue), EGFP/EGFP-Gal4 (green), R+-S.W (red). (Scale bars, 5 µm.)

