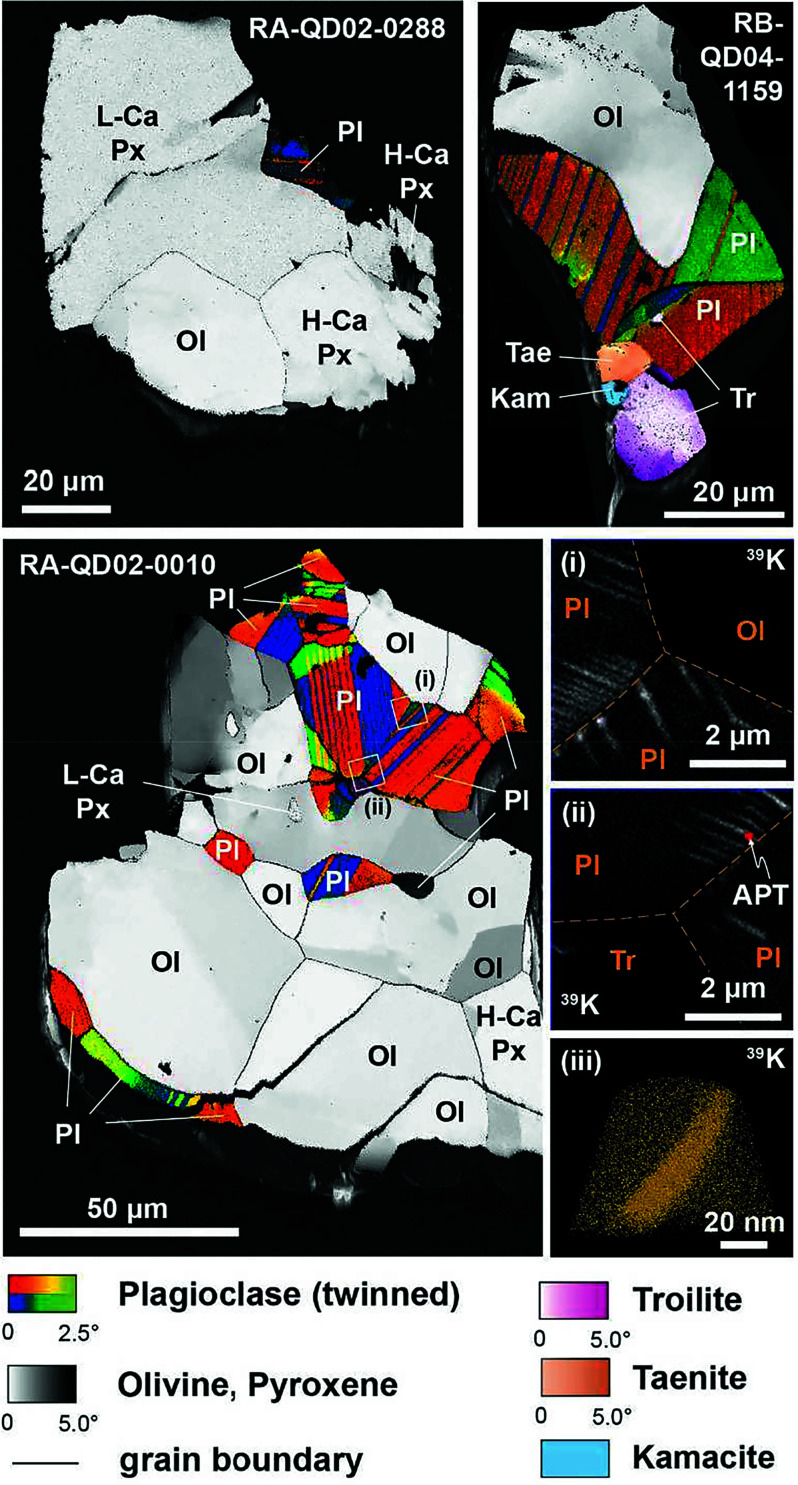
Fig. 1.
Crystallographic orientation maps of Itokawa particles measured by EBSD. Grains of each phase are colored for crystallographic misorientation angle (up to 5°) from the average orientation, showing very low total lattice strain in each grain. Insets (i) and (ii): distribution of 39K revealed by ToF-SIMS from particle #0010. Orange dashed lines represents the boundary between grains. Inset (iii): nanoscale 39K distribution by APT of the feature located on (ii). Each yellow sphere represents one atom of 39K. The distribution of K in plagioclase of particle #0010 is heterogeneous with radiating K-rich lamellae around grain boundaries. Pl = plagioclase; Ol = olivine; H-Ca Px = high-Ca pyroxene; L-Ca Px = low-Ca pyroxene; Tr = troilite; Tae = taenite; Kam = kamacite.

